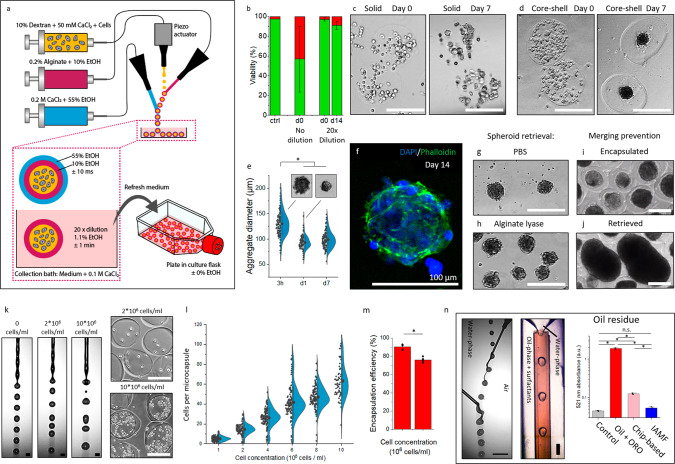
Fig. 3. Clean mass production of viable spheroids using in-air-generated cell-laden microcapsules.
a Schematic of triple-jet in-air microfluidic cell encapsulation in microcapsules. b Viability quantification of encapsulated 3T3 fibroblasts with and without 20x dilution upon collection (n = 85 microcapsules). Data is presented as mean values ± SD. Microphotographs of c solid microgels and d hollow microcapsules containing 107 3T3 fibroblasts/ml after 0 and 7 days culture. e Quantification and microphotographs of 3T3 fibroblast spheroid diameter within microcapsules during 7 days of culture (n = 60, p = 1.37E-29). Data is presented as mean values ± SD. f Confocal fluorescence microphotograph of a microcapsule and its 3T3 spheroid of which the nuclei are stained with DAPI (blue) and its F-actin is stained with phalloidin (green) after 14 days of culture. Microphotographs of spheroids of which their respective microcapsule was instantly dissolved using g PBS or h alginate lyase after 14 days of culture. Microphotographs of i non-merging encapsulated spheroids and j merging de-encapsulated spheroids. k Microphotographs of droplet formation using solutions containing 0, 2*106 and 107 cells/ml. l Quantification of cells per microcapsule for various cell concentrations ranging up to 107 cells/ml (n = 60). Data is presented as mean values ± SD. m Encapsulation efficiency of microcapsule production using 2*106 or 107 cells/ml was quantified (n = 60, p = 1.01E-4). Data is presented as mean values ± SD. n Microphotograph of conventional oil-based microfluidic droplet formation using oil and surfactants, microphotograph of samples obtained with oil-based microfluidics using Oil Red O (ORO) stained oil, and absorbance at 521 nm for residue oil quantification. The chip-based sample was obtained through three thorough washing steps (n = 3). Data is presented as mean values ± SD. Significance was determined based on one-way ANOVA analysis. The significance of p < 0.05 is indicated by *. A.U. Indicates arbitrary units. Scale bar is 200 µm unless stated otherwise.

