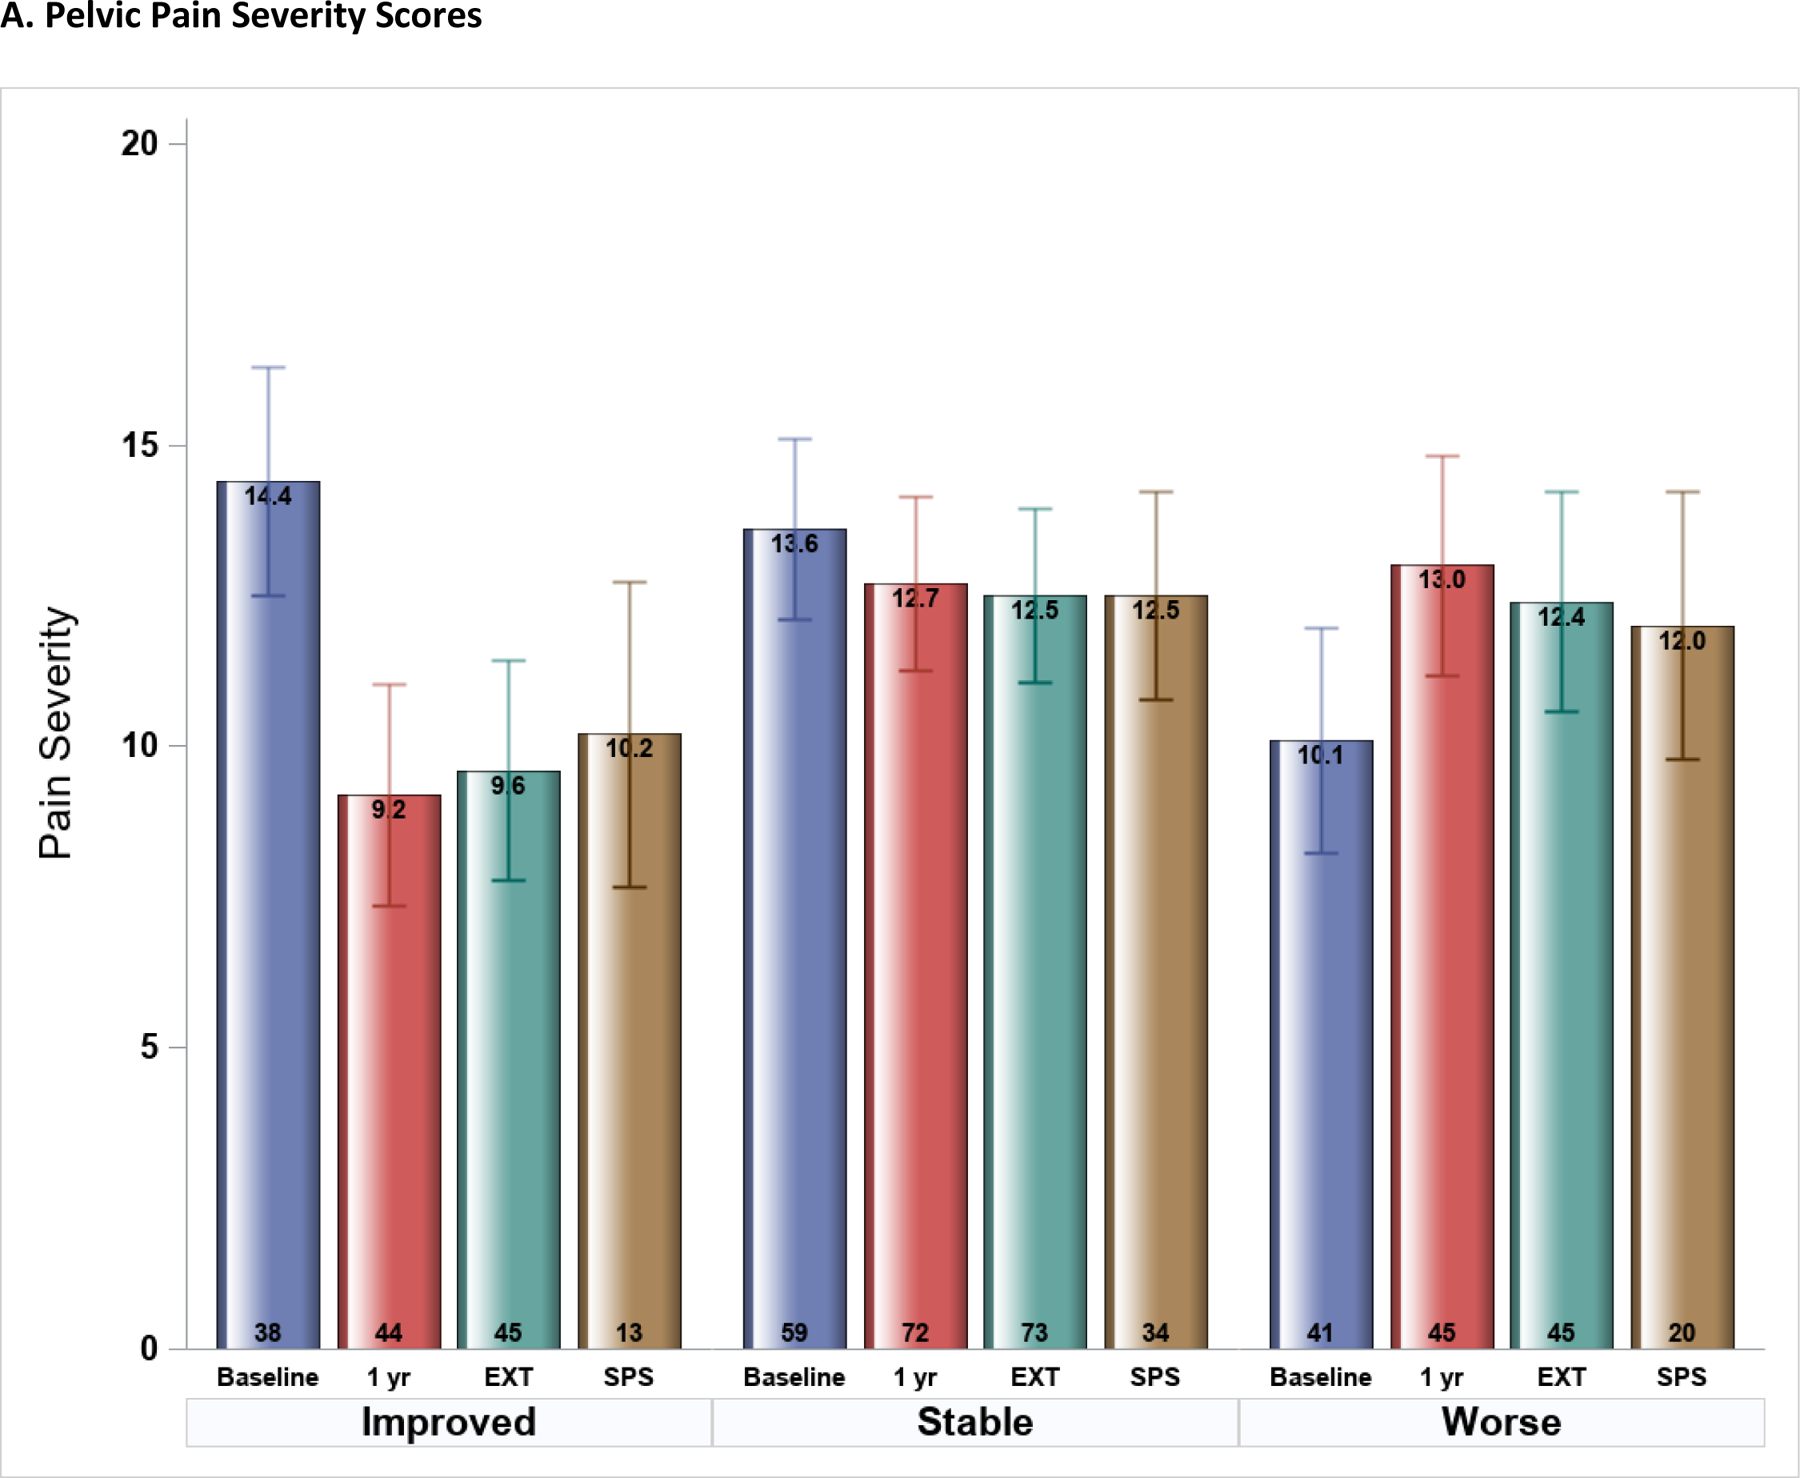
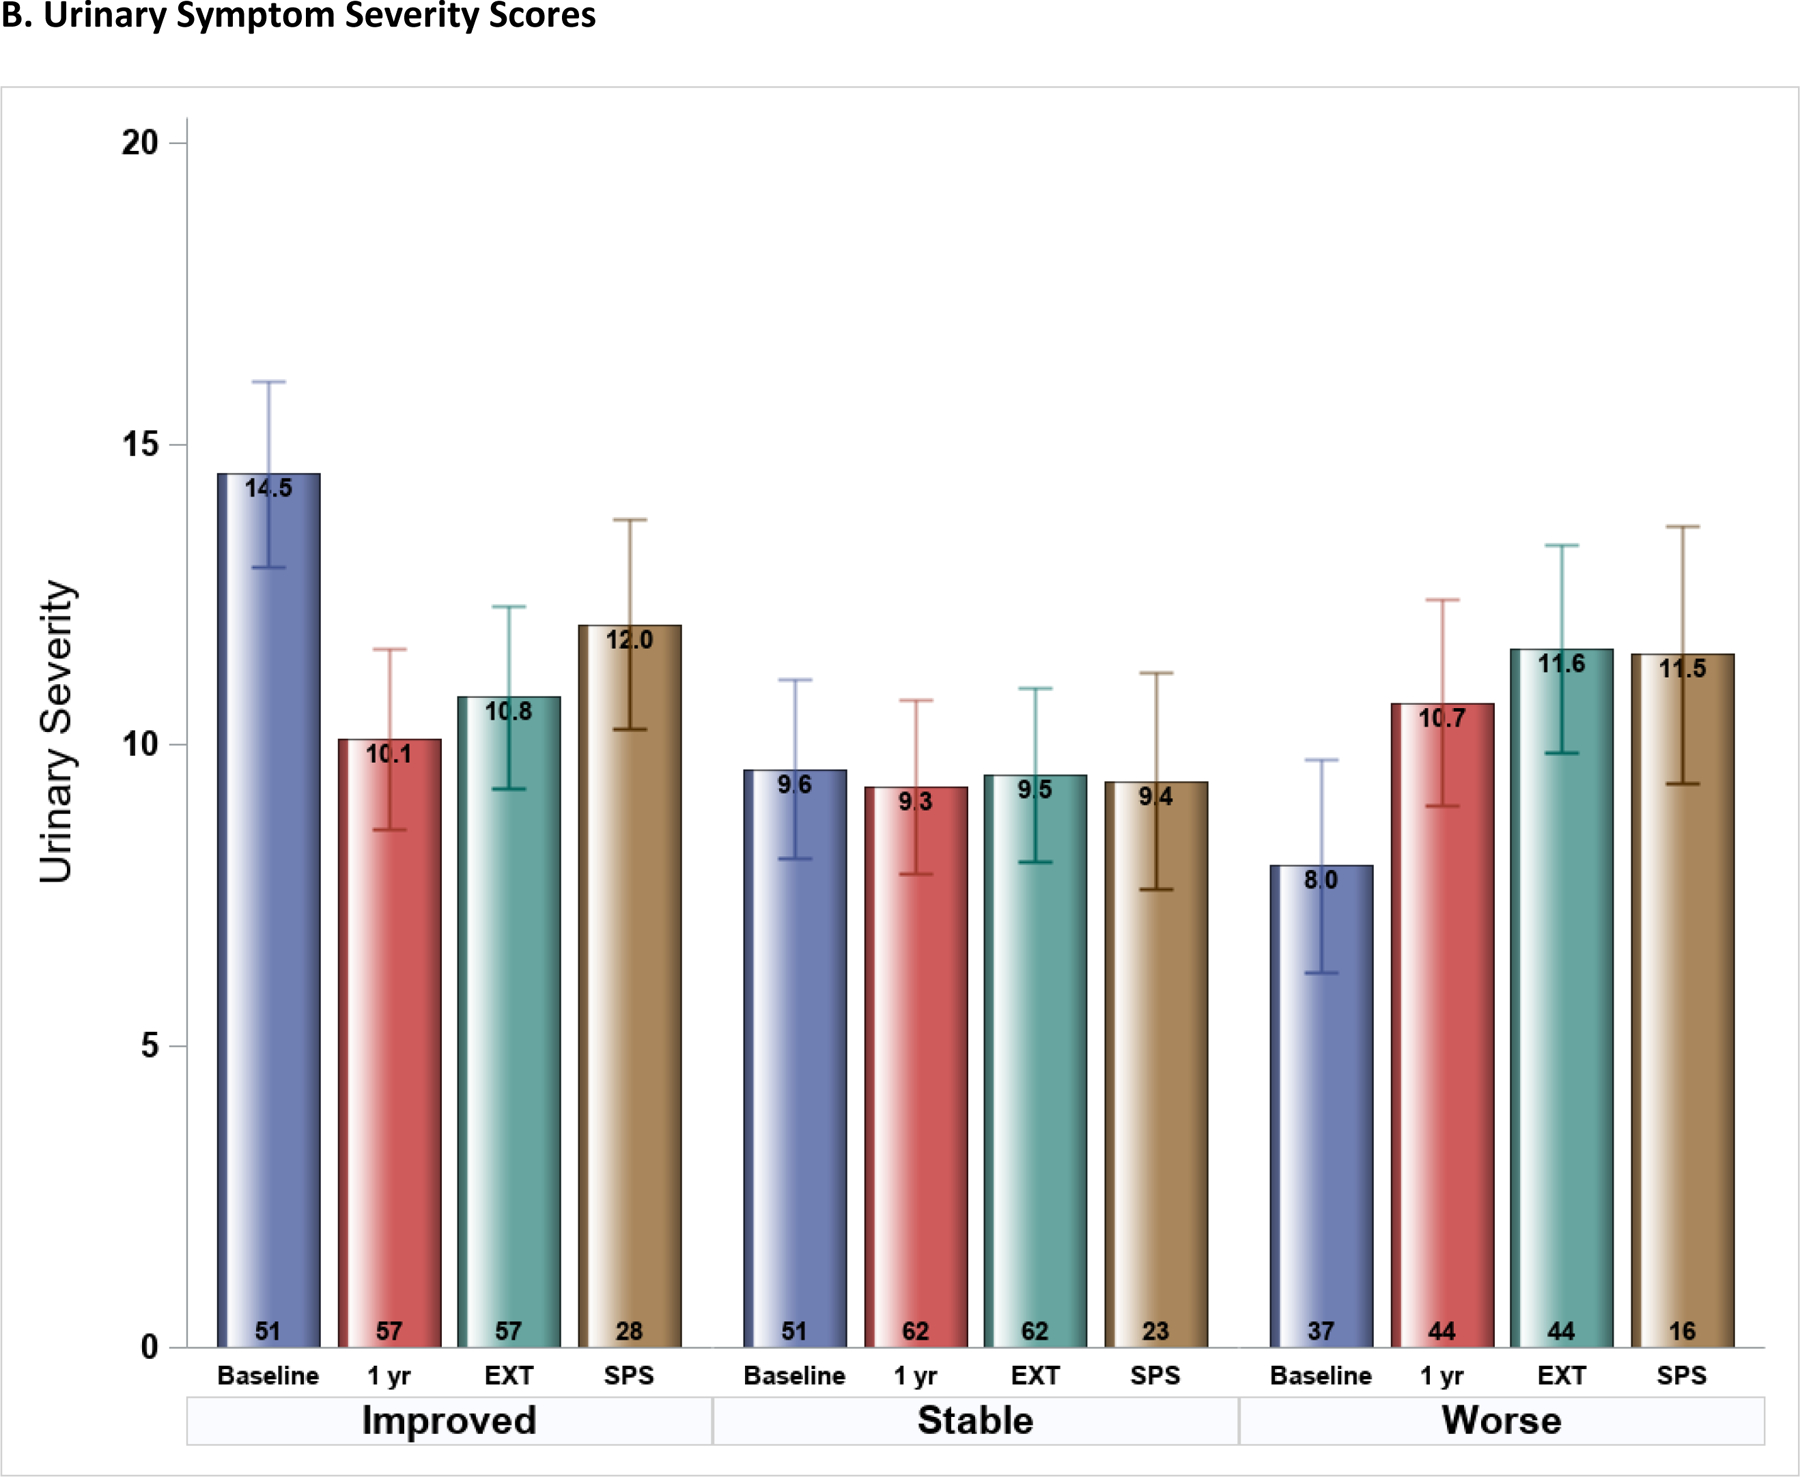
Figure 2.


Symptom Severity scores at four study time-points (Epidemiology and Phenotyping Study Baseline and 1-year visits, Extension (EXT) phase, and Symptom Pattern Study (SPS) phase) stratified by 1-year symptom profiles (improved, stable, worse) (n=163). Mean (SE) scores shown were estimated from multi-phase mixed effects models, adjusted for baseline symptom severity. A. Pelvic Pain Severity scores, B. Urinary Symptom Severity scores.
