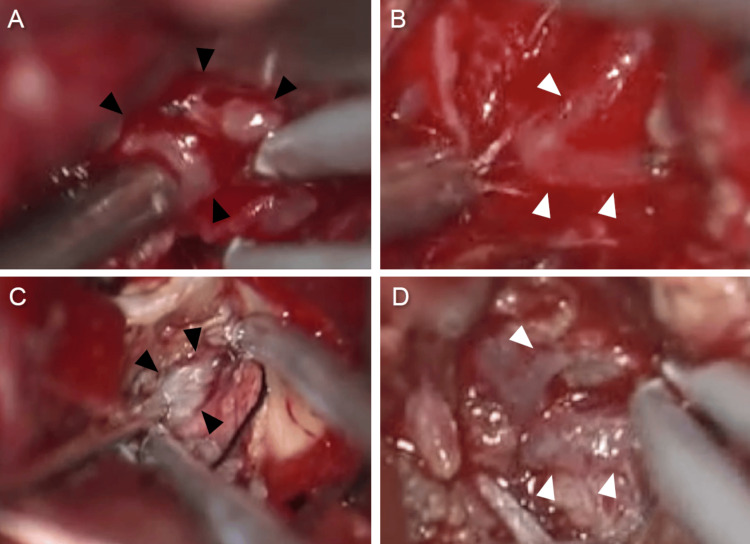
Figure 3. Intraoperative images during the first and second surgeries.
Intraoperative images during the first surgery show severe bleeding during tumor resection (A). The dilated red vein in the tumor (white arrowheads) in the first surgery (B). Intraoperative images in the second surgery show less bleeding during tumor removal (C). The red vein in the first surgery turns to the normal color (white arrowheads) in the second surgery (D). Black arrowheads indicate the tumor (A and C)

