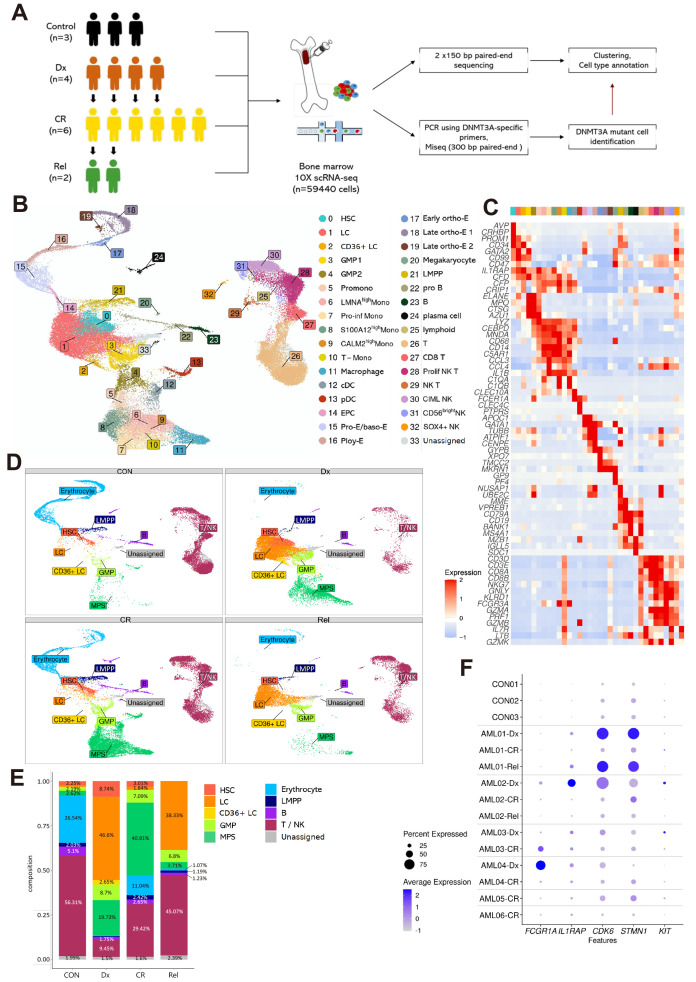
Fig. 1. Single-cell RNA sequencing (scRNAseq) analysis of patients with acute myeloid leukemia (AML) reveals differences in cell-type proportions with disease stage.
(A) Schematic workflow of the study. BM-MNCs (bone marrow-derived mononuclear cells) collected from three healthy donors and six patients with AML at different disease stages (Dx, CR, and Rel) were subjected to scRNAseq. Control (CON), healthy donor; Dx, diagnosis; CR, complete remission; Rel, relapse. (B) UMAP visualization of total cells. Colors indicate 34 cell-types. HSC, hematopoietic stem cell; LC, leukemic cell; GMP, granulocyte-monocyte progenitor; Promono, promonocyte; Mono, monocyte; cDC, conventional dendritic cell; pDC, plasmacytoid dendritic cell; EPC, erythrocyte precursor cell; Pro-E, proerythroblast; baso-E, basophilic erythroblast; Poly-E, polychromatophilic erythroblast; ortho-E, orthochromatic erythroblast; LMPP, lymphoid-primed multipotential progenitor. (C) Heatmap showing the expression of cell-type specific markers used for annotation. Each column represents a cluster (0-33). (D) UMAP visualization showing the composition of ten cell-type groups according to disease stage (CON, Dx, CR, and Rel). GMP, cluster 3-4; MPS (mononuclear phagocyte system), cluster 5-13; Erythrocyte, cluster 14-20; B, cluster 22-24; T/NK, cluster 25-32. (E) Relative cell-type proportion according to disease stage. Samples were grouped by disease stage, not by patient. The number above the graph indicates the percentage of the proportion. The Proportion percentage, which was less than 1%, were not indicated. (F) Dot plot showing expression of known AML marker genes (FCGR1A, IL1RAP, CDK6, STMN1, and KIT) between samples. Dot size represents the percentage of cells expressing the genes within the samples. Blue and white represent high and low expression, respectively.

