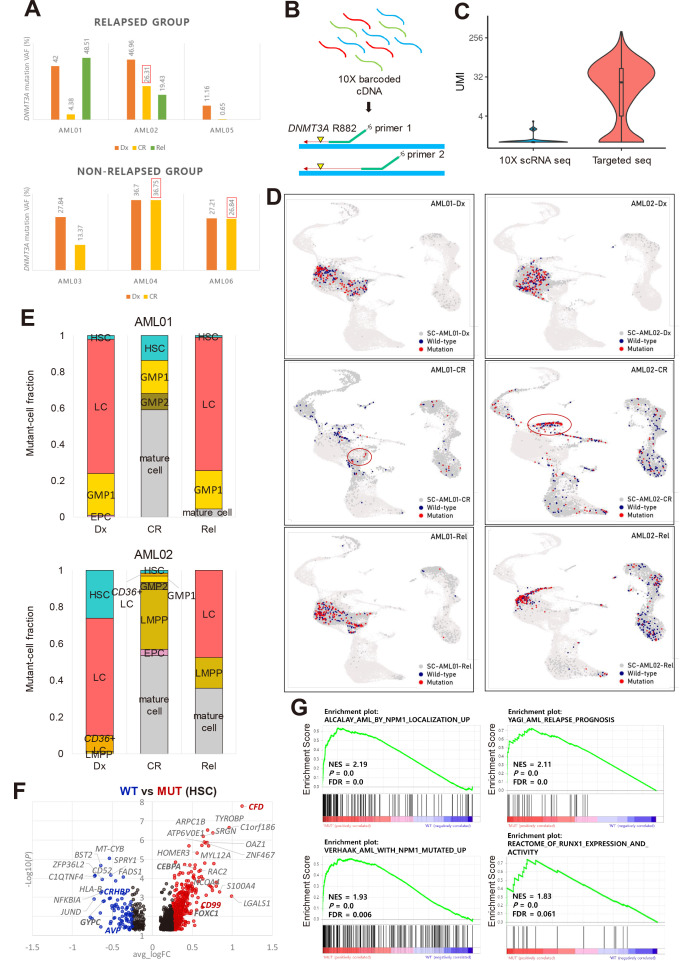
Fig. 3. Identification of DNMT3A-mutant cell-type and signatures.
(A) Targeted DNA sequencing results showing that AML02 (relapsed) and AML04 and AML06 (non-relapsed) have a high DNMT3A VAF at CR. AML, acute myeloid leukemia; VAF, variant allele frequency; CR, complete remission. (B) Simple description of targeted sequencing process. Single cell barcoded cDNAs were amplified using mutation site-specific primers and a custom Python script was used to identify DNMT3A-mutant cells with at least one mutant read. (C) Unique molecular identifiers (UMIs) per cell at the DNMT3A mutation locus from all CR samples and Rel samples from AML02. (D) Plot showing DNMT3A-mutant and wild-type (WT) cells projected onto the UMAP cluster from AML01 and AML02 according to disease stages. Red, DNMT3A-mutant cell; navy, DNMT3A WT cell; dark gray, no DNMT3A coverage. Red circle indicates the cell-type with the highest mutant-cell fraction at CR: GMP1 for AML01, LMPP for AML02. (E) Fraction of DNMT3A-mutant cells in each cluster at different disease stages in AML01 and AML02. Mutant cell fraction: number of mutant cells in each cell-type divided by the total number of mutant cells in each sample. Mature cell-types excluding stem/progenitor cell-types were merged. HSC, hematopoietic stem cell; LC, leukemic cell; GMP, granulocyte-monocyte progenitor; EPC, erythrocyte precursor cell; Dx, diagnosis; Rel, relapse; LMPP, lymphoid-primed multipotential progenitor. (F) DEGs (differentially expressed genes) between DNMT3A-mutant and WT cells in HSC of AML samples. Red dots indicate upregulated genes in DNMT3A-mutant cells. Blue dots indicate downregulated genes. Black dots indicate genes with a log2 fold change < 0.25. Genes of interest are marked in bold. (G) GSEA (gene set enrichment analysis) plots of unregulated gene sets in DNMT3A-mutant cells compared to WT cells. NES, normalized enrichment score; P, P value; FDR, false discovery rate.

