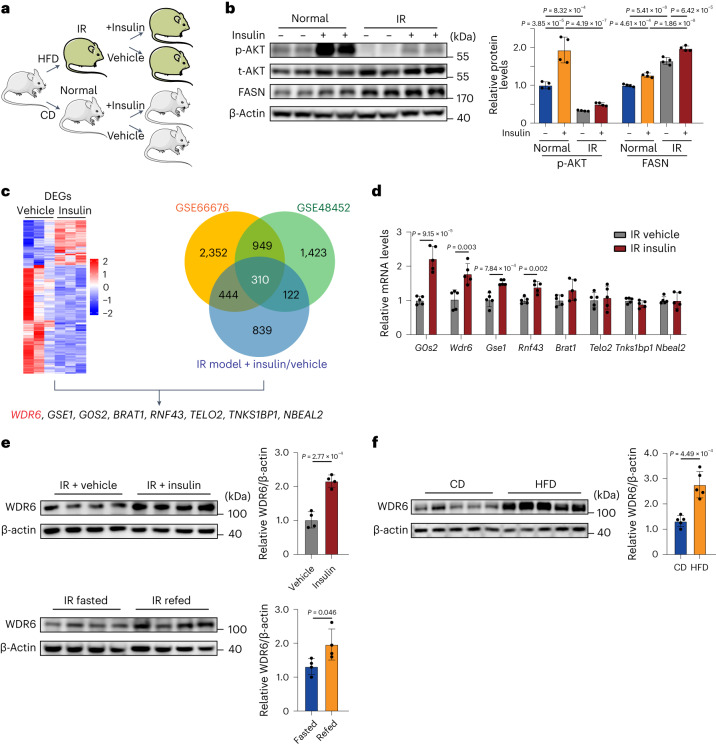
Fig. 1. WDR6 is upregulated in response to insulin in insulin-resistant states.
a, Schematic illustrating the groups and procedures of the IR model. Mouse icons produced using Servier Medical Art by Servier (https://smart.servier.com/) under a Creative Commons Attribution 3.0 Unported Licence (https://creativecommons.org/licenses/by/3.0/). b, Western blots of phosphorylation of AKT at Ser473, a ‘classic’ downstream molecule of insulin action and of FASN levels in liver in the indicated groups. n = 4 biologically independent mice per group. β-actin served as a loading control. c, The strategy for identification of candidate genes for insulin-induced lipogenesis in liver. Transcriptomic analysis of DEGs in liver of insulin-treated and vehicle-treated groups during IR. Left: n = 3 biologically independent mice per group. Right: Venn diagram showing the common set of 310 genes identified at the overlap of two public datasets and our transcriptome data. d, RT–PCR analysis of the response of the candidate genes to insulin stimulation in liver during IR states. Expression levels were normalized to Actb mRNA levels. n = 5 biologically independent mice per group. e, Western blots of hepatic WDR6 in insulin-treated and vehicle-treated IR mice and fasted/refed IR mice. n = 4 biologically independent mice per group. f, Western blots of hepatic WDR6 after 28 weeks in the HFD-induced NAFLD mouse model and control mice. n = 5 biologically independent mice per group. Experiments in b–f were performed using male mice. Data in b are presented as the mean ± s.d., determined by two-way analysis of variance (ANOVA) and Tukey’s multiple-comparisons test. Data in d–f are presented as the mean ± s.d., determined by unpaired two-sided Student’s t-test.

