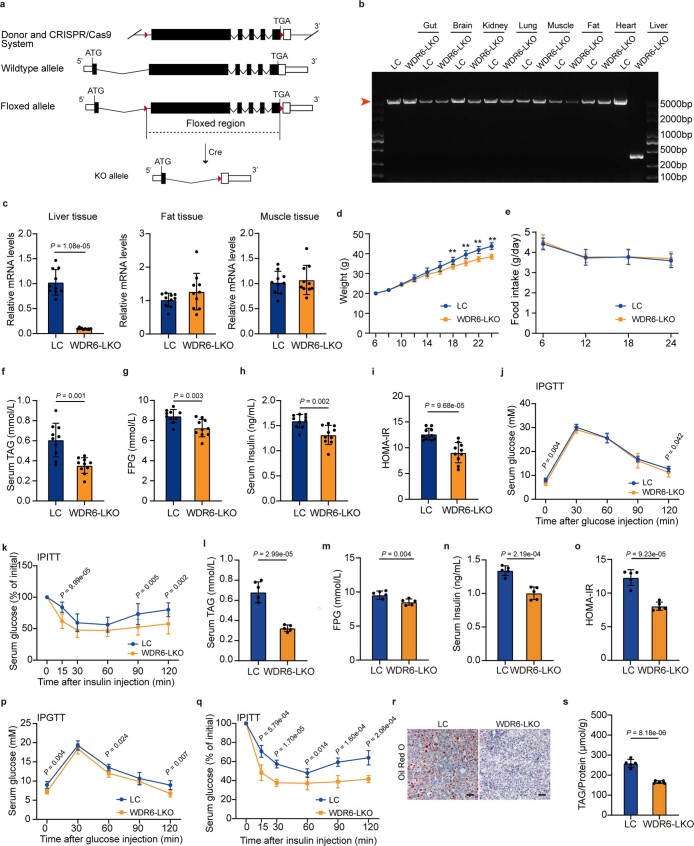
Extended Data Fig. 4. Liver-specific knockout of Wdr6 prevents HFD-induced IR, related to Fig. 2.
8-week-old WDR6-LKO and LC mice were fed HFD for 16 weeks. a, Schematic diagram illustrating the building strategy of WDR6-LKO mice. b, PCR analysis revealing Wdr6 fragments generated from the different tissues of WDR6-LKO mice, red arrow indicates the PCR fragment of wildtype Wdr6 allele. c, RT-PCR analysis of Wdr6 mRNA levels in liver, fat and muscle tissue. The expression of Wdr6 was normalized to Acta1 or Actb mRNA levels. n = 10 biologically independent mice per group. d-e, Change curves of body weight, food intake. n = 6 biologically independent mice per group. f-k, Serum TAG, FPG, insulin levels and HOMA-IR index and IPGTT and IPITT of male WDR6-LKO mice and control, n = 10 biologically independent mice per group. l-o (♀), Serum TAG, FPG, insulin levels and HOMA-IR index of female WDR6-LKO mice and control, n = 5 biologically independent mice per group. p,q (♀), IPGTT and IPITT of female WDR6-LKO mice and control, n = 6 biologically independent mice in LC group, n = 5 biologically independent mice in WDR6-LKO group. r (♀), Representative ORO staining of female mice liver sections of female WDR6-LKO mice and control. Scale bars, 50 μm. s (♀), Liver TAG level of female WDR6-LKO mice and control. n = 5 biologically independent mice per group. Data in (c) and (f) are presented as mean ± SD, determined by unpaired two-sided Mann-Whitney test. Data in (d-e), (g-q) and (s) are presented as mean ± SD, determined by two-sided Student’s t-test. * P < 0.05, ** P < 0.01.

