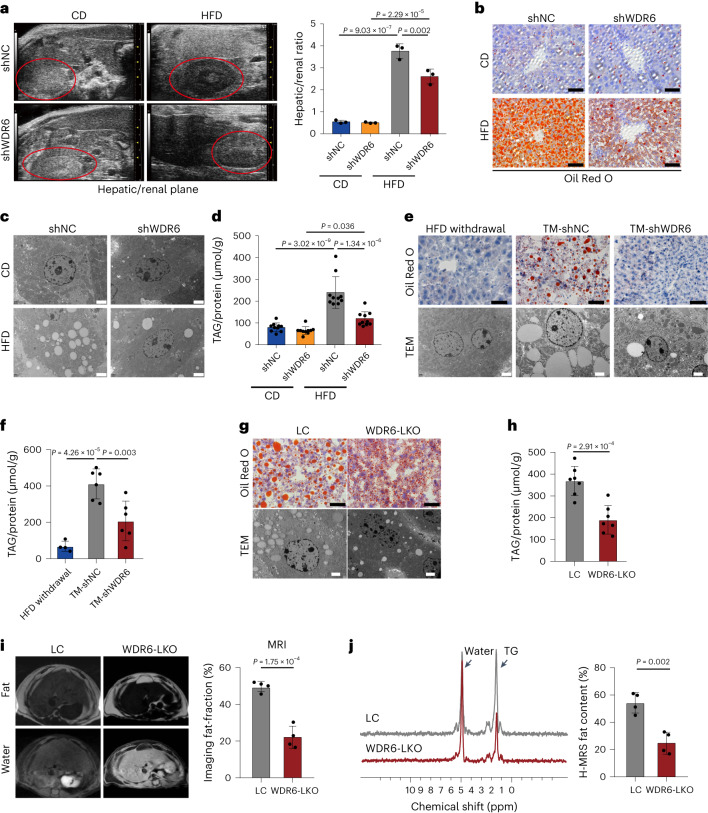
Fig. 2. Liver-specific intervention of Wdr6 strongly protects against excessive liver triacylglycerol deposition during high-fat-diet-induced insulin resistance.
a, Liver B-mode ultrasound imaging of hepatic/renal plane (area circled in red represents the kidney) of AAV-shWDR6 and the corresponding controls. AAV-shNC mice after CD or HFD feeding for 8 weeks. n = 3 biologically independent mice per group. b, Representative ORO staining of liver sections in the indicated group in a. Scale bars, 50 μm. c, Representative TEM analysis of liver tissues in the indicated group. Scale bars, 2 μm. d, Liver TAG levels in the indicated group from a; the levels were normalized to the protein content of the same sample, n = 10 biologically independent mice per group. e, Representative ORO staining and TEM imaging were performed in liver tissues of the TM and the corresponding control. Scale bars (black), 50 μm; Scale bars (white), 2 μm. f, Liver TAG levels of the mice described in e, which were normalized to the protein content of the same sample. n = 4 biologically independent mice in the HFD withdrawal group and n = 6 biologically independent mice in the other group. g, Representative ORO staining and TEM imaging of liver tissues in WDR6-LKO and the corresponding LC mice. Scale bars (black), 50 μm; scale bars (white), 2 μm. h, Liver TAG level of WDR6-LKO and LC mice; the amount was normalized to the protein content of the same sample. n = 7 biologically independent mice per group. i, MRI analysis of fat and water suppressed images (left) and calculated fat fraction (right) in livers of WDR6-LKO mice and LC mice after HFD feeding for 16 weeks. n = 4 biologically independent mice per group. j, 1H magnetic resonance spectroscopy spectrum (1H-MRS) characteristics of liver in WDR6-LKO and LC mice. n = 4 biologically independent mice per group. Experiments in a–j were performed using male mice. Data in a, d and f are presented as the mean ± s.d., determined by two-way ANOVA and Tukey’s multiple-comparisons test. Data in h–j are presented as the mean ± s.d., determined by unpaired two-sided Student’s t-test.

