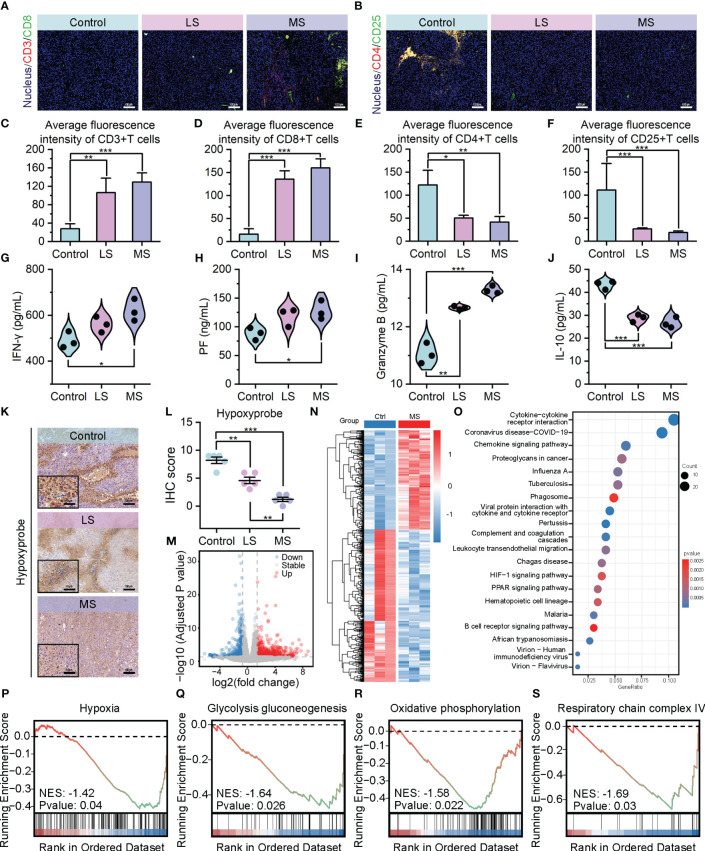
Figure 3.
Exercise improved tumor immune infiltration through hypoxia alleviation. (A–F) Immunofluorescence images of CD3+/CD8+ cells (A) and CD4+/CD25+ cells (B), and their average fluorescence intensity (C–F) of mice tumor sections following mentioned treatments (scale bar: 100 μm). (G–J) ELISA results of IFN-γ (G), PF (H) Granzyme B, (I), and IL-10 (J) levels in tumors. (K, L) Hypoxyprobe staining images (K) and IHC scores (L) of B16F10 tumor tissues in C57BL/6 mice with the specified treatments (scale bar: 100 μm, enlarged drawing: 50 μm; selected area: 5). (M) Volcano plot depicting the expression changes of 961 DEGs following MS intervention. (N) Hierarchal clustering heatmap illustrating the expression patterns of the identified 961 DEGs between the Ctrl and MS groups. Each group has three biological replication samples. The heatmap was clustered and scaled by the DEGs. (O) Dot plot highlighting the top 20 significantly enriched pathways identified through KEGG enrichment analysis. (P–S) GSEA revealing the significantly altered pathways or biological processes following MS intervention. The data were presented as mean ± s.d. Statistical significance of the differences between groups was determined using t test. *, p<0.05; **, p<0.01; ***, p<0.001.

