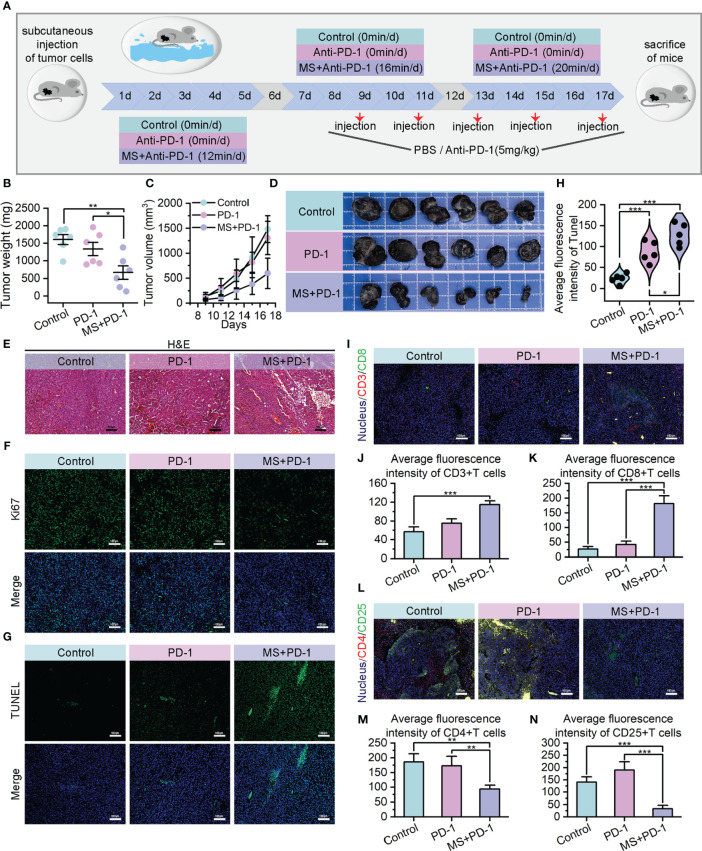
Figure 4.
Exercise achieved in vivo Anti-PD-1 immunotherapy sensitization. (A) Schematic diagram of moderate intensity swim treatment and Anti-PD-1 combination therapy model construction. (B–D) Tumor weights (B), growth curves of tumor volumes (C) and tumor images (D) of different treating groups. (E) H&E staining images of resected tumors (scale bar: 100 μm, enlarged drawing: 50 μm). (F) Immunofluorescence images of Ki67 in tumor sections from mice after different specified treatments (scale bar: 100 μm). (G, H) TUNEL immunofluorescence images (G) and average fluorescence intensity (H) of tumor sections. (scale bar: 100 μm, selected area: 5). (I–K) Immunofluorescence images of CD3+/CD8+ cells (I) and their average fluorescence intensity (J, K) in tumor sections of mice treated by different therapies (scale bar: 100 μm). (L–N) Immunofluorescence images of CD4+/CD25+ cells (L) and their average fluorescence intensity (M, N) in tumor sections of mice treated by different therapies (scale bar: 100 μm). The data were presented as mean ± s.d. Statistical significance of the differences between groups was determined using t test. *, p<0.05; **, p<0.01; ***, p<0.001.

