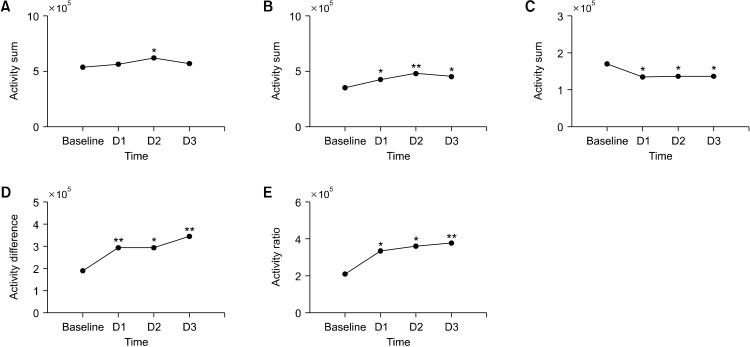
Fig. 2.
The effect of the quinpirole injection over time. Each index of the locomotor activities was seen at baseline before the quinpirole administration, the first day (D1), the second day (D2), the third day (D3) after the quinpirole administration. (A) 24 hr sum. (B) Dark phsse sum. (C) Light phase sum. (D) Dark light difference. (E) Dark light ratio. The asterisks indicate the statistical significance when the data is compared to the baseline values by one-way repeated measures ANOVA.
*p < 0.05, **p < 0.01.

