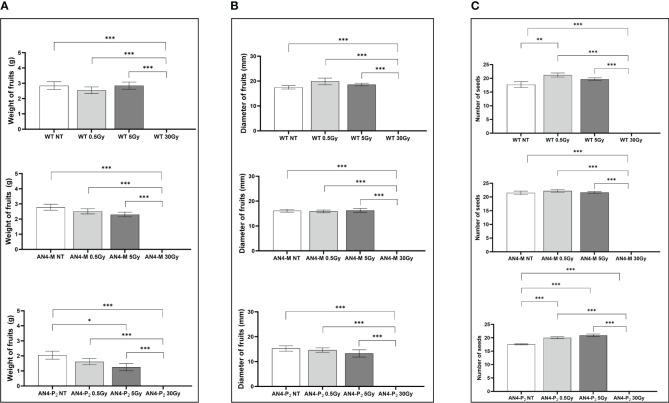
Figure 9.
Intra-genotype analysis of weight (A), diameter of fruits (B) and number of seeds (C) of wild type, AN4-M and AN4-P2 MicroTom ripe fruits upon the different irradiation treatments supplied to plants at 30 DAS. Mean values ± SE are shown ( = 5). Analysis of variance was conducted by one-way ANOVA. Tukey’s post-hoc test was used as a statistical hypothesis testing. Asterisks indicate the statistically significant differences (Statistical relevance: *p<0.05; **p<0.001; ***p<0.0001).

