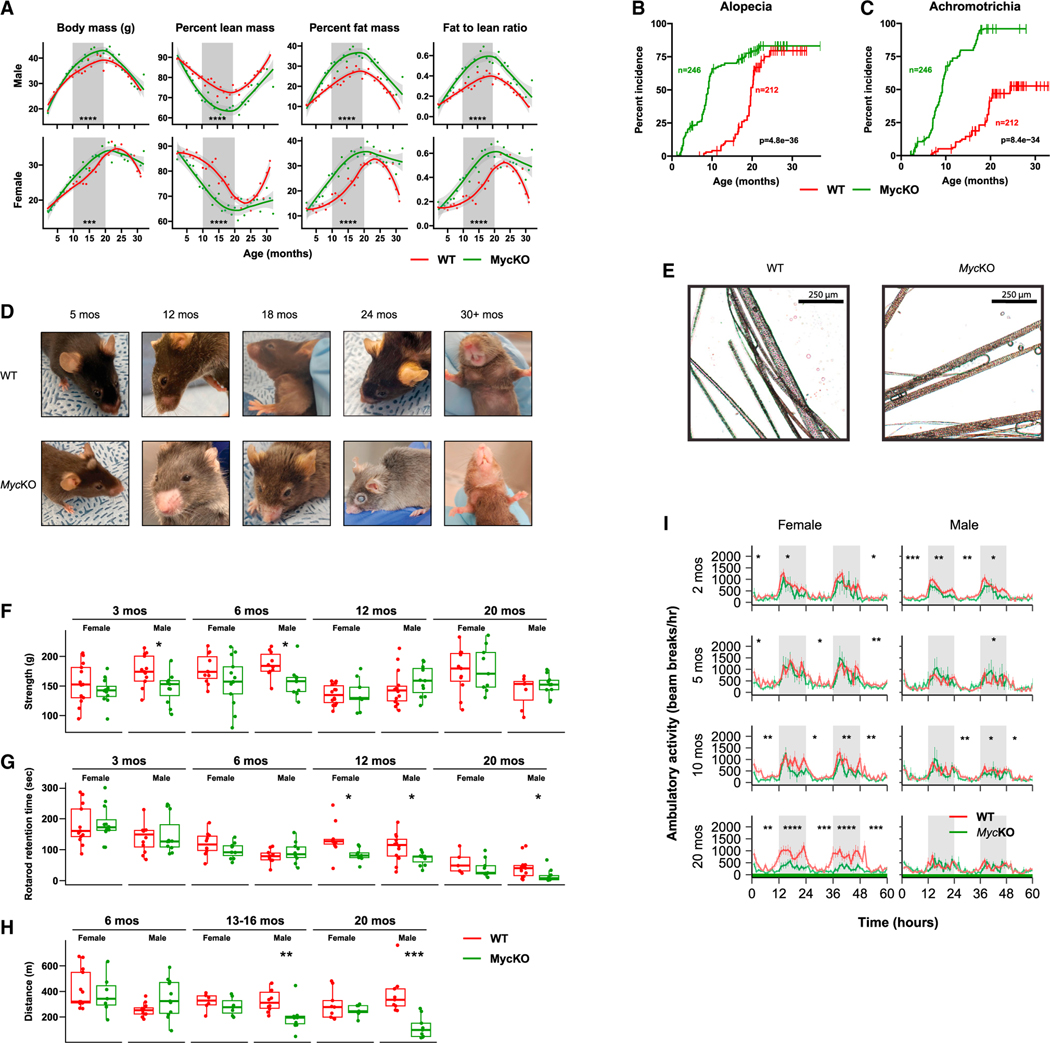
Figure 1. Young MycKO mice display aging-related phenotypes.
(A) Weight and body composition of male and female WT and MycKO mice. Each point represents the mean of measurements performed on 10–20 animals performed over 2–3 days. Times during which differences existed between the two groups are indicated by gray shading.
(B) Premature alopecia in MycKO mice.
(C) Premature achromotrichia in MycKO mice.
(D) Appearance of representative WT and MycKO mice. See Video S1 for additional examples.
(E) Close-up images of fur from 20-month-old WT and MycKO mice showing the interspersion of dark and gray strands in the former cohort versus the greater uniformity of gray color among individual strands in the latter.
(F) Four-limb GripMeter testing performed on male and female animals. n = 9–13.
(G) Rotarod testing of WT and MycKO mice. n = 5–14.
(H) Treadmill running. Cohorts of WT and MycKO mice were allowed to maintain a continuous pace on an automated treadmill until becoming exhausted. n = 6–13.
(I) Diurnal activity of WT and MycKO mice of the indicated ages as measured in metabolic cages. n = 5–10 males and 5–10 females at each age. White and gray-shaded regions of the plots denote day and night, respectively. (A, F, G, and H) Unpaired t test; (B and C) log rank test; (I) ANOVA145; *p < 0.05, **p < 0.01, ***p < 0.001, ****p < 0.0001. Error bars: standard error of the mean (SEM).

