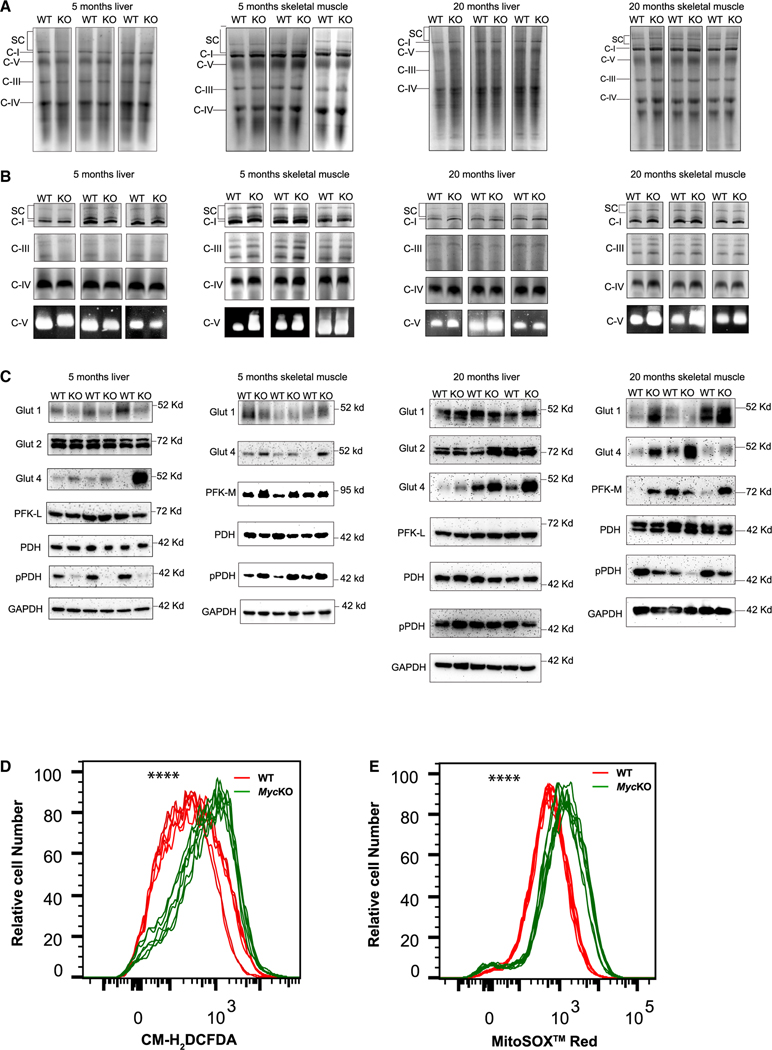
Figure 5. ETC structure and function and glucose handling differ between WT and MycKO livers and skeletal muscle.
(A) BNGE profiles of liver and skeletal muscle ETC complexes I–IV, complex V, and supercomplexes (SCs) from mitochondria of 5- and 20-month-old mice.72 SCs comprise higher-order assemblies of complexes I, III, and IV.72
(B) In situ enzymatic activity of complexes I, III, IV, and V from (A).72
(C) Immunoblot analyses of proteins involved in glucose and pyruvate transport and metabolism from the tissues shown in (A) and (B).
(D) ROS production by WT and MycKO MEFs measured by the oxidation of CM-H2DCFDA.23 n = 6.
(E) Mitochondrial-specific ROS production measured by the superoxide-mediated oxidation of MitoSOX red. n = 6. Unpaired t test, ****p < 0.0001.

