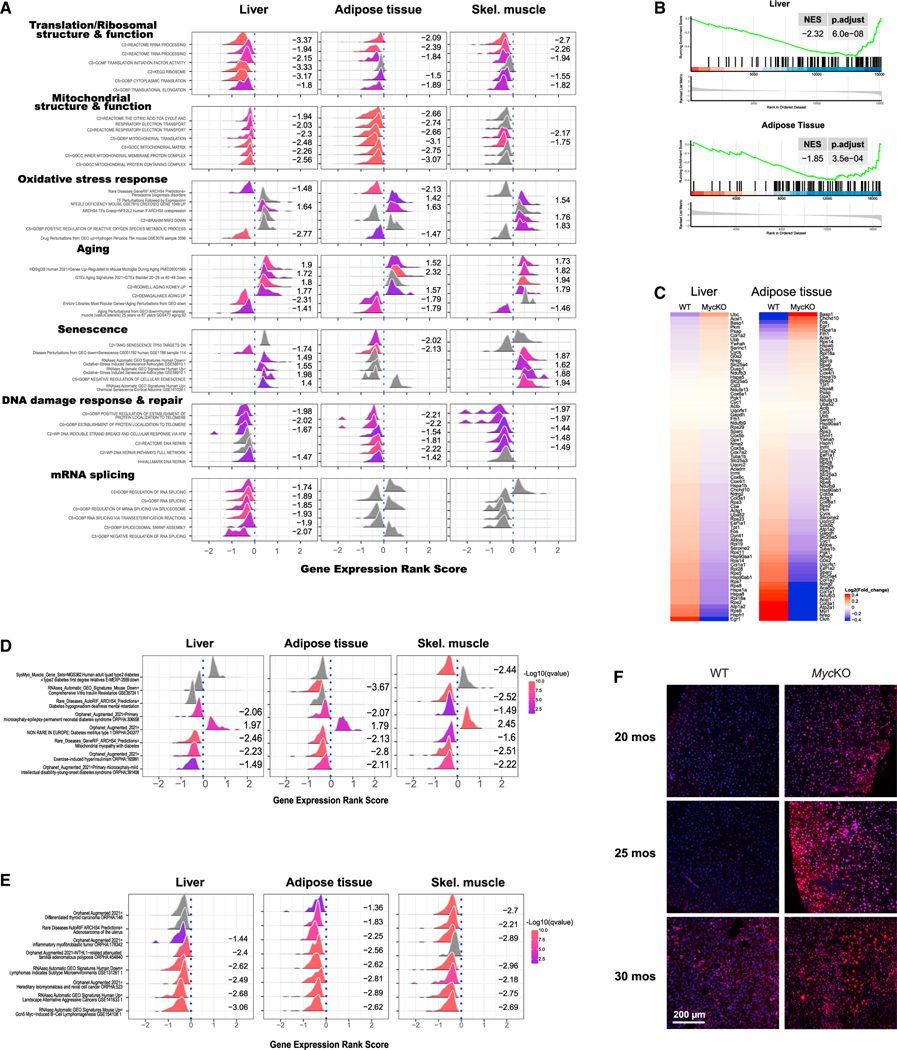
Figure 6. Tissues from 5-month-old MycKO mice are enriched for aging- and senescence-associated transcripts.
(A) GSEA from tissues of 5-month-old WT and MycKO mice.146–148 clusterProfiler displays representative examples of the most recurrent and prominent of the gene sets within each category.149,150 Numbers to the right of each profile indicate its normalized enrichment score. Curves shown in gray and lacking enrichment scores indicate gene sets that were not significantly enriched. Values >0 along the abscissas indicate gene sets that were upregulated in MycKO tissues, whereas values <0 indicate gene sets that were downregulated. See Figure S7 for standard GSEA plots of these.
(B and C) GSEA and heatmap for transcripts that correlate with aging in most tissues and across species in livers and adipose tissue of 5-month-old WT and MycKO mice.
(D) Gene sets associated with types 1 and 2 diabetes selectively enriched in the indicated tissues of 5-month-old MycKO mice.
(E) Gene sets associated with cancer selectively enriched in the indicated tissues of 5-month-old MycKO mice.
(F) Examples of immunostaining for γ-H2AX in the indicated mice depicting double-stranded DNA breaks. Shown are merged micrographs: γ-H2AX immunostaining (red) and DAPI staining (blue).

