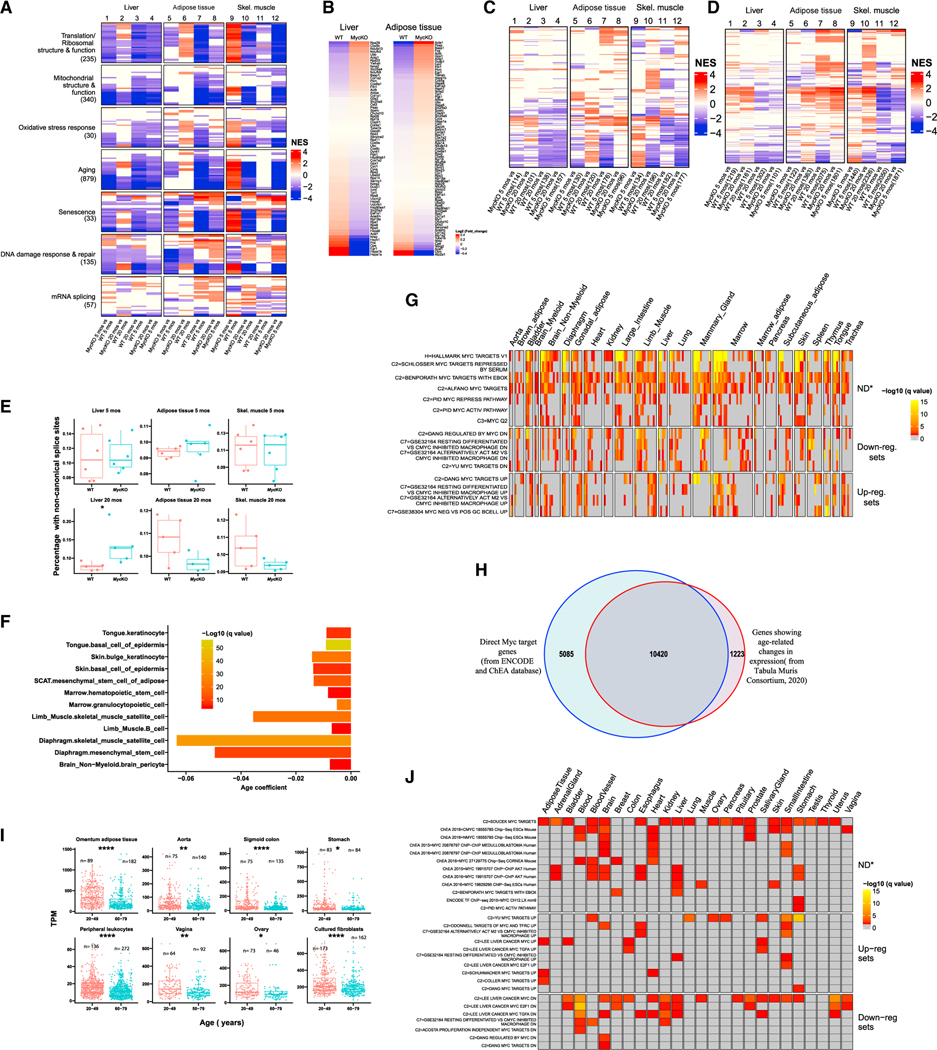
Figure 7. Gene expression differences in young and old mouse tissues reflect declines in Myc and Myc target genes.
(A) Age- and Myc-dependent gene set enrichment differences among 5- and 20-month-old WT and MycKO tissues. n = 5. The total number of gene sets for which significant enrichment was observed is indicated beneath each category. Colored lines within each category represent a single gene set, the top 30 of which are shown for each category. Data S1 lists all relevant gene sets and others depicted here.
(B) Heatmap for the 79 transcripts shown in Figures 6B and 6C that correlate with aging in most tissues examined and across species.
(C) Heatmap of individual gene sets related to types 1 and 2 diabetes, including those depicted in Figure 6D from 5- and 20-month-old WT and MycKO mice.
(D) Heatmap for the expression of individual gene sets related to cancer, including those depicted in Figure 6E from 5- and 20-month-old WT and MycKO mice.
(E) Transcriptome-wide quantification of non-canonically spliced transcripts.149–152 Unpaired t test, *p < 0.05.
(F) Significant declines in Myc transcript levels in 12 of 90 single-cell populations derived from 23 individual young (1–3 months) and old (18–30 months) mousetissues.103 Results are expressed as q values based upon correlation coefficients that compared transcript levels across aging populations.
(G) Overrepresentation analysis of 58 Myc target gene sets analyzed using the above-cited single-cell RNA-seq data from young versus old mice.103 Gene sets for which significant dysregulation was observed in at least 40 of the 90 single-cell populations are shown, although 74 of the cell populations (82.2%) showed enriched representation of at least one gene set (Data S1). Down-reg. sets, downregulated in response to Myc overexpression; Up-reg. sets, upregulated in response to Myc overexpression; ND, sets comprising both positive and negative targets whose overall direction of response could not be determined. (H) Overlap between direct Myc target genes and those that undergo significant age-related changes in expression (q < 0.05).104,105 Gene expression differences were compared from 76 single-cell populations derived from 23 tissues from 1- to 3- and 18- to 30-month-old mice.103 (I) Myc transcript differences in young and old human tissues. Results are from the Broad Institute’s GTEx database.
(J) Enrichment of Myc target gene sets (see Figures S6A–S6C) in aging and senescent human tissues and cell lines. (E and I) Unpaired t test, *p < 0.05, **p < 0.01, ****p < 0.0001.

