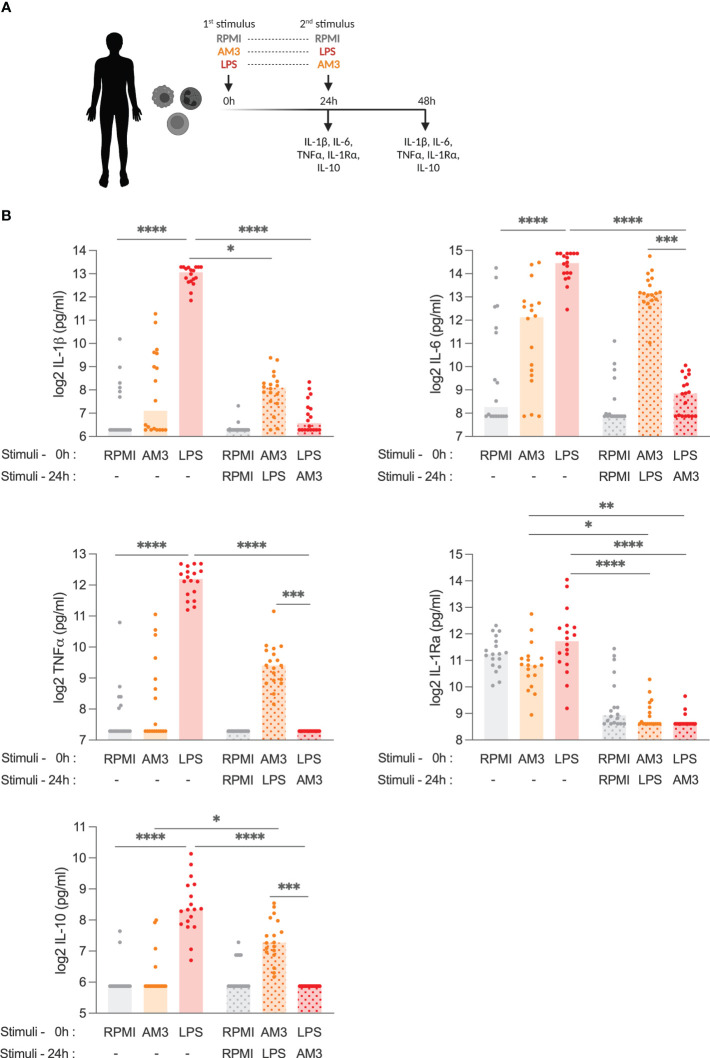
Figure 1.
AM3 treatment limits LPS-driven cytokine response in human PBMCs (A) Experimental design: adherent PBMCs were stimulated with primary stimuli and supernatants were collected for cytokine detection at 24h, then cells were washed with control medium to remove any residue of the primary stimulation before secondary stimuli were added to the cultures following which the supernatants collected after an additional 24h (48h in total). (B) Cytokine production from PBMCs at 24 hours and at 48 hours after stimulation with medium control (RPMI), AM3 and LPS, eventually combined as by (A) in a number of healthy donors (n=18). Friedman test with Dunn’s multiple comparison was applied to compare experimental groups, *p<0.05, **p<0.01, ***p<0.001, ****p<0.0001. Bars without pattern: cytokine levels measured 24 hours after first stimulation, Patterned bars: cytokine levels measured 48 hours after first stimulation. Values for the groups RPMI (1st) + AM3 (2nd), RPMI (1st) + LPS (2nd), AM3 (1st) + RPMI (2nd), and LPS (1st) + RPMI (2nd) are presented in Figure S2B .

