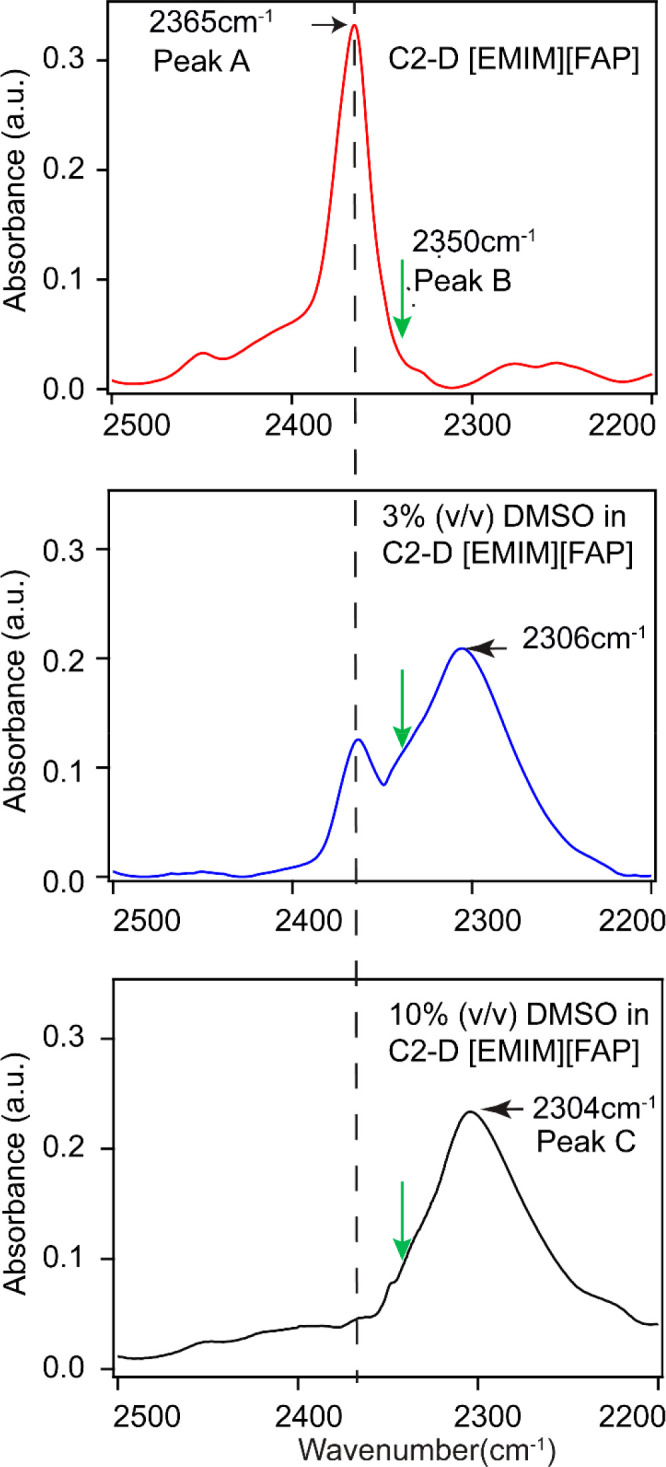
Figure 2.

C–D band of [EMIM][FAP] at 2365 cm–1 (top), which splits upon adding DMSO (middle) and red-shifts by >60 cm–1 (bottom) to a single peak. The dilution percentage is approximate. The green arrow shows the approximate location of the hidden peak B, which was later revealed by 2DIR spectroscopy.
