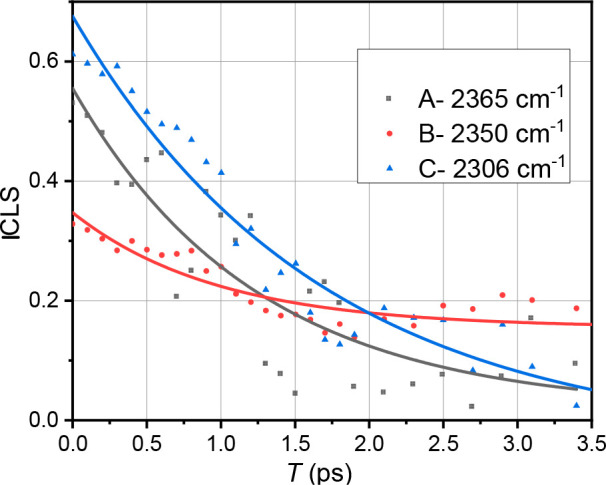
Figure 4.

ICLS decays for the C–D stretching mode of deuterated C-2 for peaks A (black) and B (red), which were determined for [EMIM][FAP], and peak C (blue), which was determined for 10% (v/v) DMSO. Note that the peak B spectral diffusion was also determined from the10% (v/v) DMSO sample, and the data were similar within the noise level.
