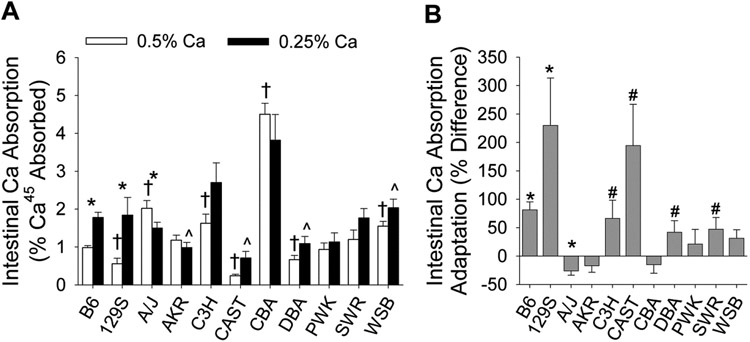
Fig. 1.
Ca absorption and adaptation of Ca absorption to low Ca intake is variable among 11 inbred mouse lines. Bars reflect the mean ±SEM (n=4-14 per diet for each line). (A) Unadjusted Ca absorption values, * dietary groups within a line differ significantly (p<0.05); line mean differs significantly relative to the B6 reference line (p<0.05), † for the 0.5% Ca group, ^ for the 0.25% Ca group. (B) Adaptation of Ca absorption to low dietary Ca intake; adaptation significantly differs from 0 (*, p<0.05; #, p<0.1).

