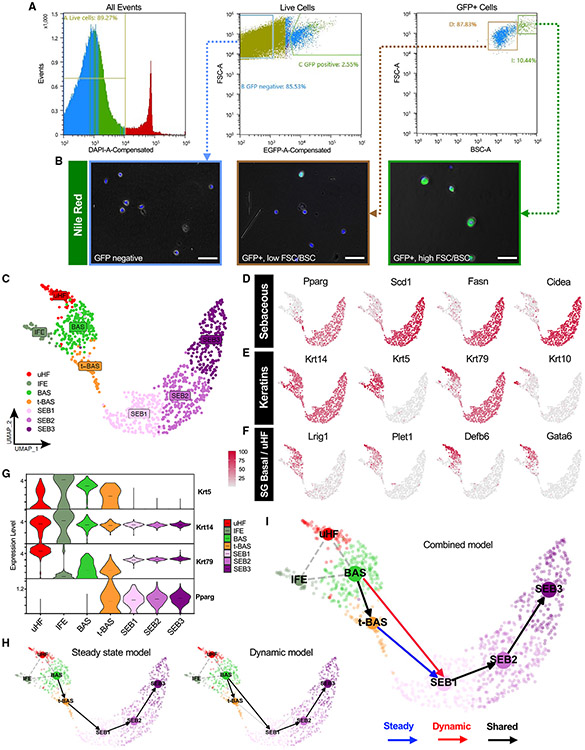
Figure 3. Isolating and profiling SG cells.
(A) Flow cytometry plots of isolated cell suspensions from 8-week-old PPARγ;YFP label-on skin.
(B) Nile red staining (green) of sorted keratinocyte sub-populations: bulk GFP negative (left), GFP+ with low FSC/BSC (middle), and GFP+ with high FSC/BSC (right). Note that GFP epifluorescence is not visible and does not interfere with bright Nile red staining, which was superimposed upon bright-field images.
(C) UMAP projection showing seven cell clusters isolated from YFP-sorted, 8-week-old PPARγ;YFP label-on skin.
(D) Feature plots for canonical SG genes.
(E) Feature plots for key keratin genes.
(F) Feature plots for markers of SG basal cells, sebaceous duct, isthmus, and infundibulum.
(G) Violin plots showing relative expression of key marker genes across different cell sub-populations. Note that t-BAS cells uniquely express both Krt5 and Pparg. Horizontal lines indicate median values.
(H) RNA-velocity trajectory analysis performed using scVelo with either a steady-state (left) or dynamic (right) model.
(I) Trajectory analysis incorporating results from both steady-state and dynamic models, suggesting that BAS cells enter the transitional t-BAS state before differentiating into SEB-1 sebocytes (blue arrow) or can differentiate directly into SEB-1 sebocytes (red arrow). Black arrows, lineage relationships identified by both models. Gray dotted lines indicate statistical connectivity between clusters. Trajectories predicted by scVelo originating from the IFE were removed for clarity. Scale bar, 50 μm. See also Figures S1 and S2, Data S1 and S2.

