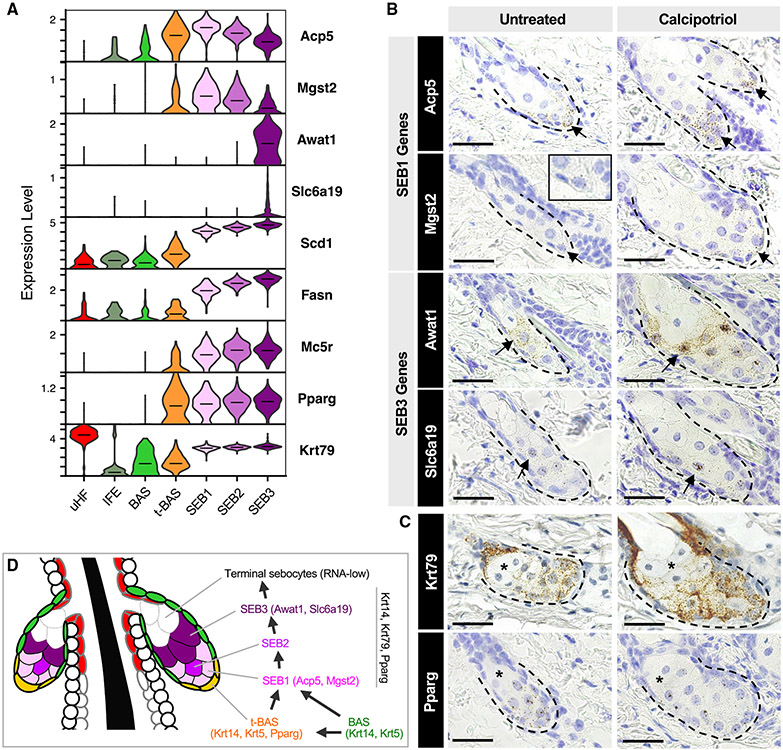
Figure 5. Spatial mapping of different sebocyte cell states.
(A) Violin plots showing relative expression of key marker genes in the SG. Horizontal lines indicate median values.
(B) RNAscope in situ staining for genes enriched in SEB-1 (Acp5, Mgst2), and genes enriched in SEB-3 (Awat1, Slc6a19). Arrow, region where gene is highly expressed. Inset, magnified view of Mgst2 staining.
(C) RNAscope staining for Krt79 and Pparg in the SG. Asterisk, RNA-low terminal sebocytes. Left column, untreated wild-type skin. Right column, calcipotriol-treated skin.
(D) Schematic summarizing both direct and indirect paths for differentiation of SG basal cells into sebocytes. Scale bar, 50 μm.

