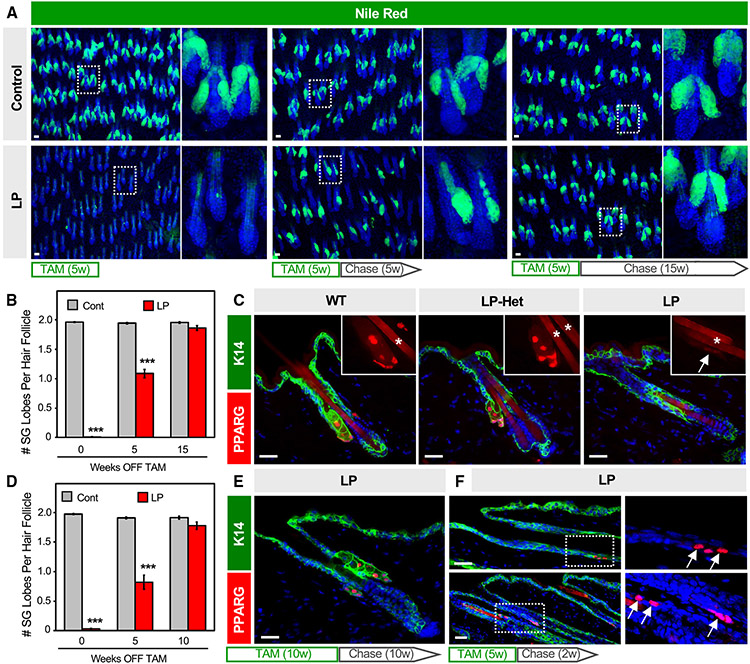
Figure 6. SGs regenerate following genetic ablation.
(A) Nile red staining (green) of skin whole mounts from control or LP mice treated with tamoxifen (TAM)-containing chow for five continuous weeks, then moved onto normal chow (“chase”) for an additional 0 (left), 5 (middle), or 15 (right) weeks. Right panels are magnified views of the boxed areas.
(B) Quantitation for (A).
(C) Localization of PPARγ (red) in wild-type (left), Lrig1-CreERT2;Pparg-fiox/+ (LP-Het, middle) or LP mice (right) following 5 weeks of TAM-chow. Insets, magnified views of PPARγ staining. Arrow, faint PPARγ staining at the hair follicle isthmus in LP skin. Asterisk, hair shaft autofluorescence.
(D) Quantitation of SGs similar to (B) but for mice treated with 10 continuous weeks of TAM-chow, followed by 0–10 weeks’ chase.
(E) Regenerated SGs express PPARγ (red).
(F) Expression of PPARγ (red, arrows) in basal K14+ cells (green) of the upper anagen ORS (top panels) and isthmus (bottom panels), after 5 weeks of TAM-chow and 2 weeks’ chase. Right panels are magnified single-channel views of the boxed areas. w, weeks. ***p < 0.001 by unpaired t test comparing control (cont) and LP skin from the same time point. n ≥ 7 mice, per genotype, per time point for (B) and (D). Data are represented as mean ± SEM. Scale bar, 50 μm. See also Figure S3.

