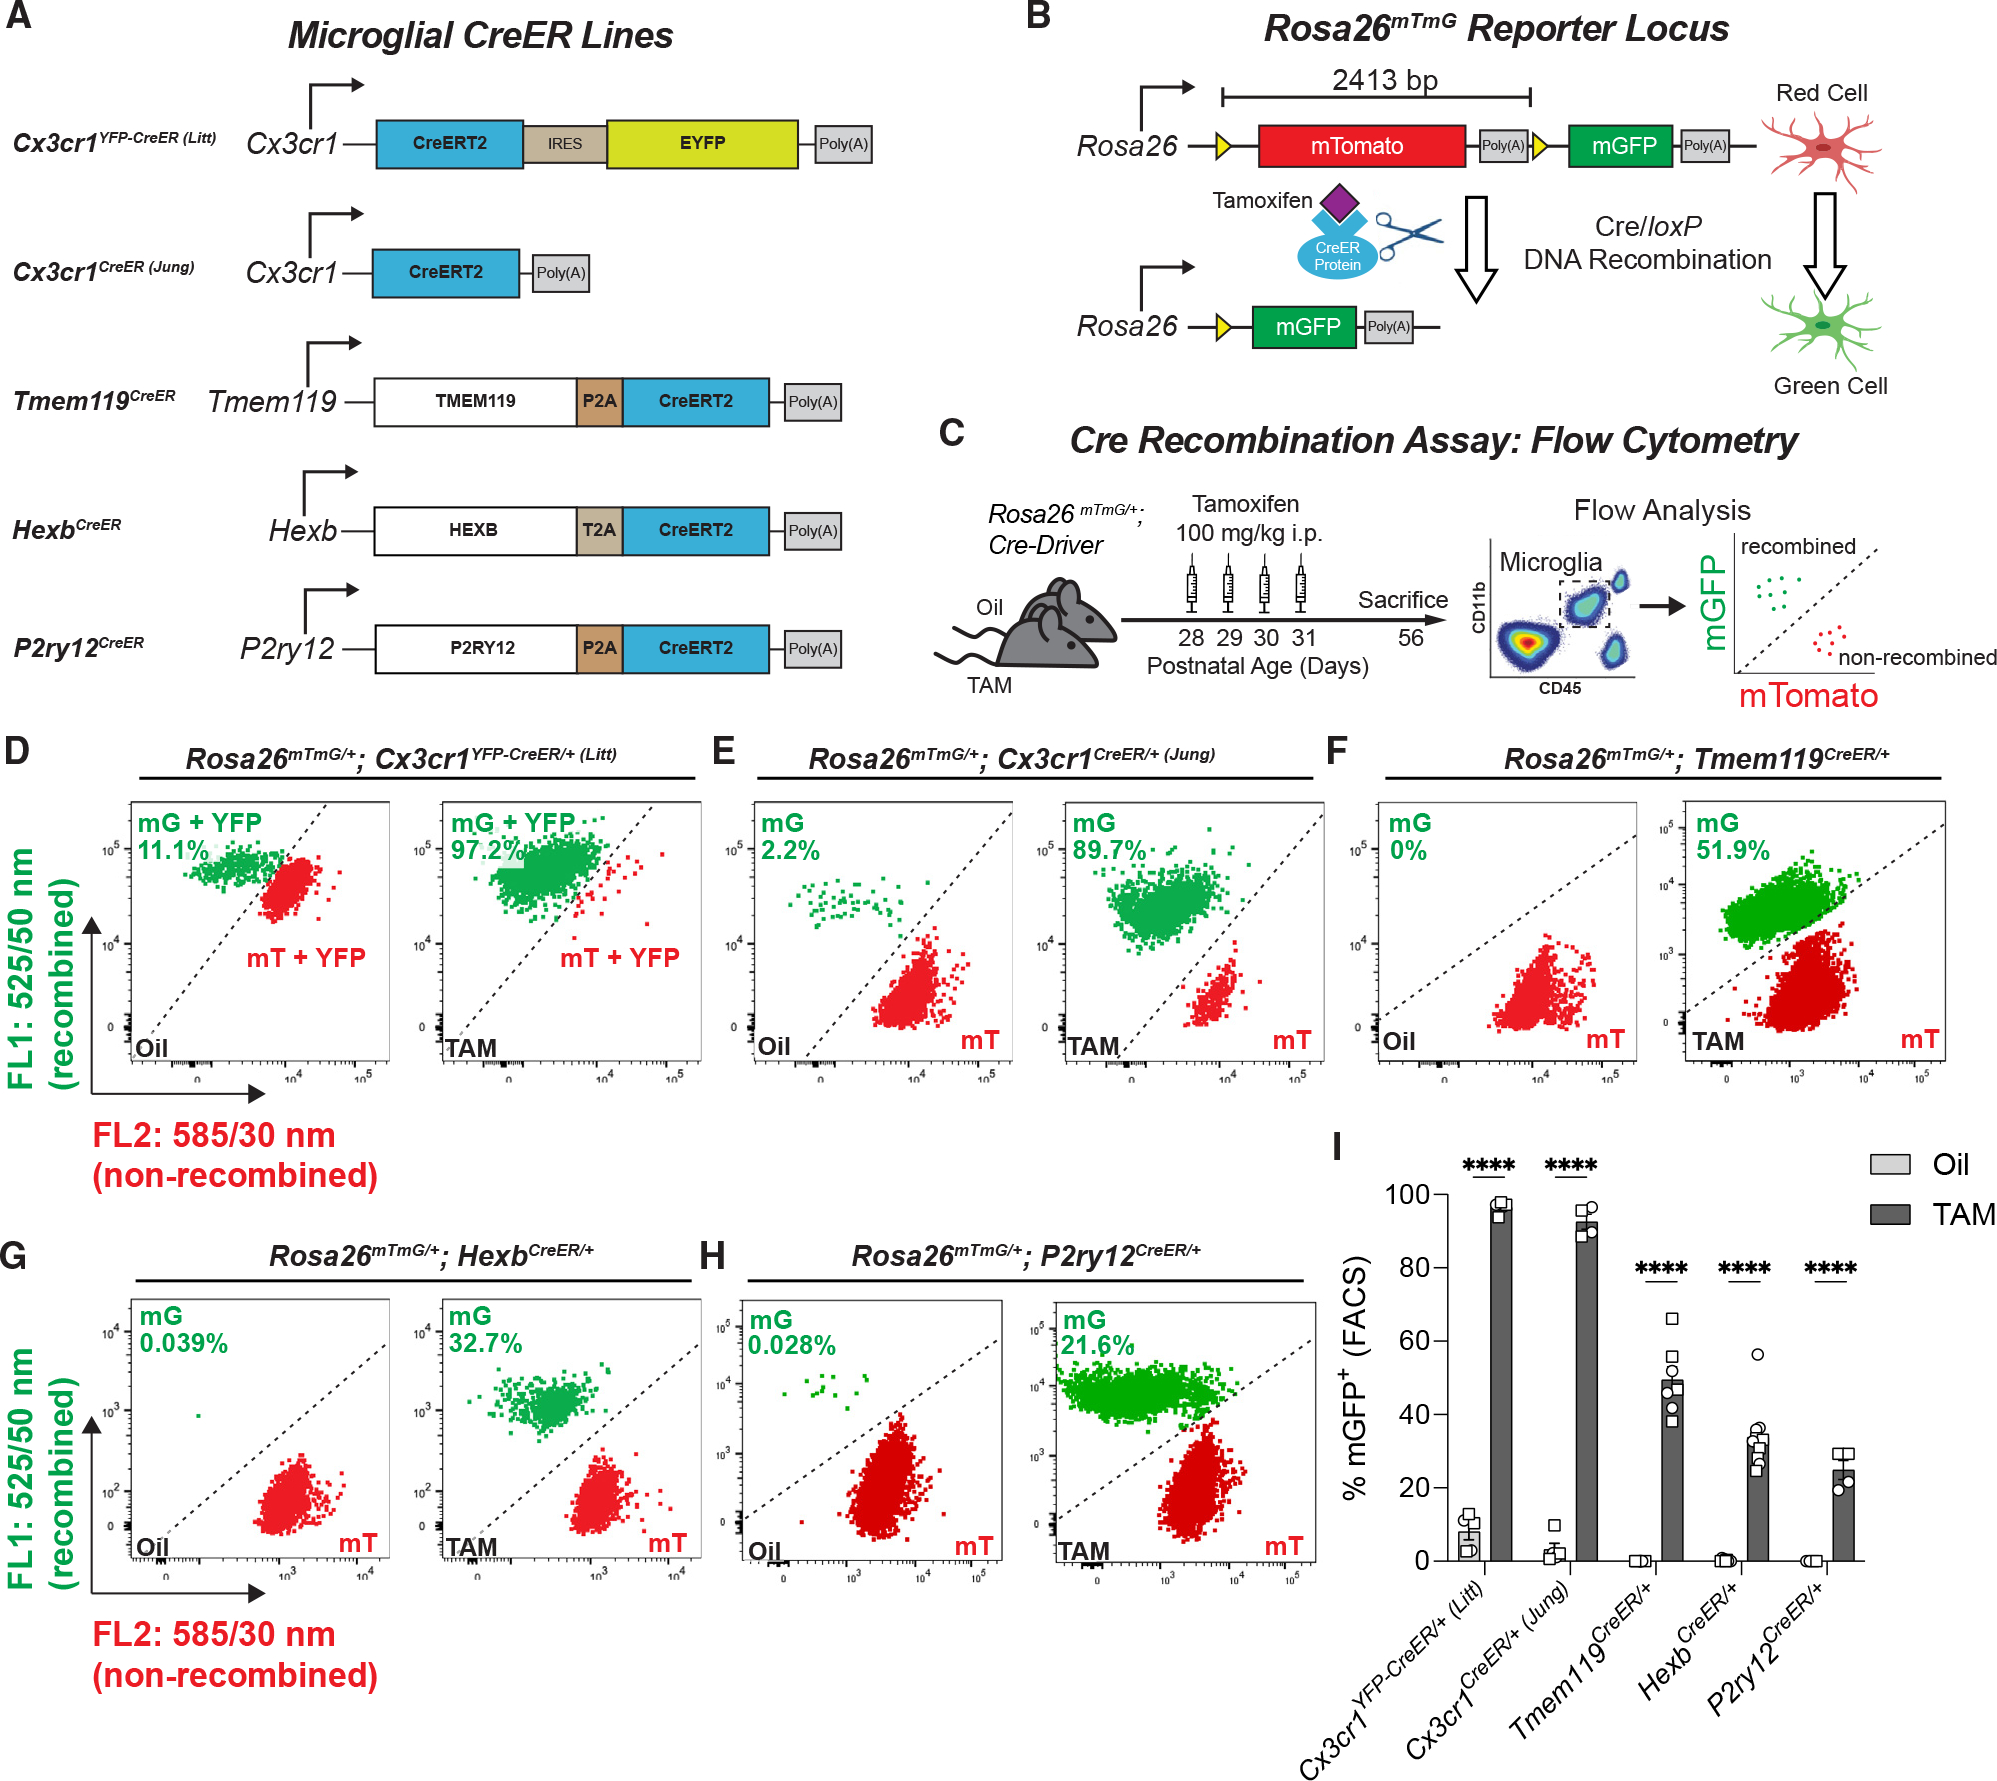
Figure 1. Recombination efficiency varies across microglial CreER lines.

(A) Diagram of transgenes used to express CreER in Cx3cr1YFP–CreER (Litt), Cx3cr1CreER (Jung), Tmem119CreER, HexbCreER, and P2ry12CreER mice.
(B) Diagram of the Rosa26mTmG allele and corresponding cellular fluorescence before and after Cre/loxP DNA recombination. loxP sites are indicated by yellow triangles.
(C) Diagram of experimental protocol used to assess tamoxifen (TAM)-induced Cre/loxP recombination of Rosa26mTmG/+ in microglia by flow cytometry.
(D–H) Representative flow cytometry results show the percentage of mGFP+ (mG+) and mTomato+ (mT+) microglia from individual animals from each group.
(I) Quantification of the percentage of recombined mGFP+ microglia in microglial CreER lines showed increased recombination in TAM vs. oil for all five CreER lines (Student’s t tests: Cx3cr1YFP–CreER/+ (Litt):n = 5 oil, 5 TAM mice; Cx3cr1CreER/+ (Jung):n = 5 oil, 4 TAM mice; Tmem119CreER/+:n = 8 oil, 7 TAM mice; HexbCreER/+: n = 9 oil, 10 TAM mice; P2ry12CreER/+: n = 4 oil, 4 TAM mice; ****p < 0.0001). All data are presented as mean ± SEM. Individual data points indicate males (squares) and females (circles).
See also Figures S1 and S2 and Table S1.
