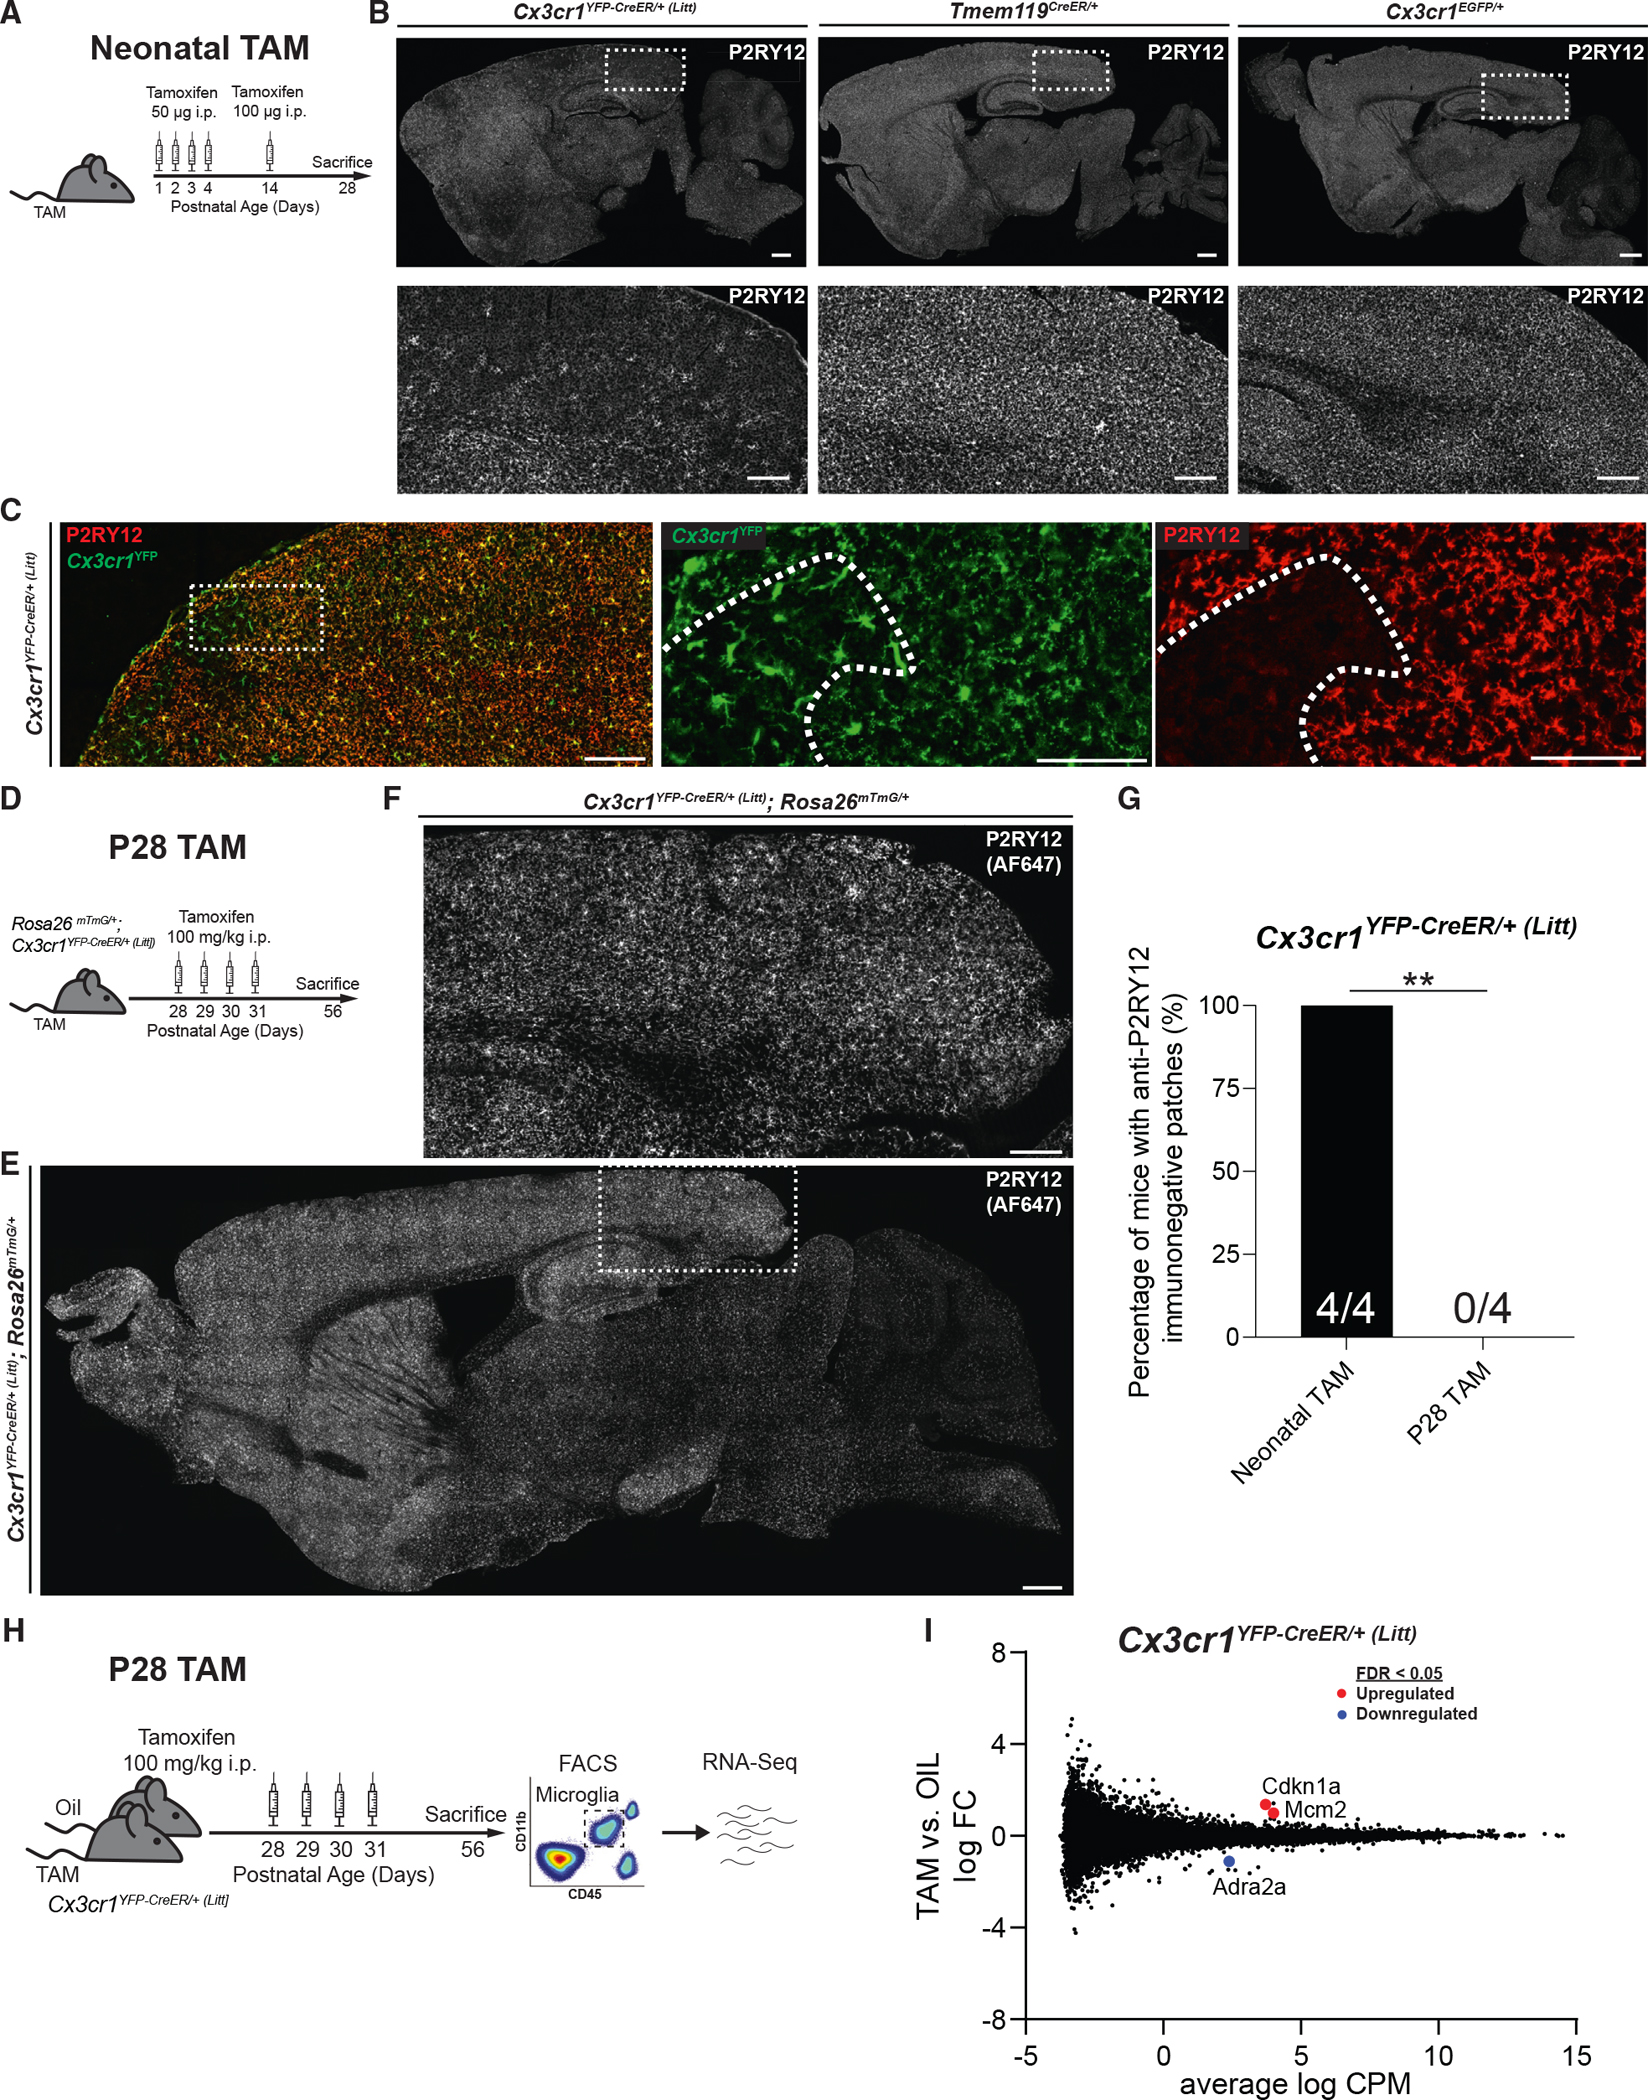
Figure 4. Off-target effects of TAM in Cx3cr1YFP–CreER (Litt) mice.

(A) Timeline of neonatal TAM injection for images in (B) and (C).
(B) Fluorescent images of brain sections from Cx3cr1YFP–CreER/+ (Litt), Tmem119CreER/+, and Cx3cr1EGFP/+ mice injected with TAM neonatally, immunolabeled with anti-P2RY12. Large regions of the cortex are devoid of anti-P2RY12 immunofluorescence in Cx3cr1YFP–CreER/+ (Litt) mice, but not Tmem119CreER/+ or Cx3cr1EGFP/+ mice. Scale bars, 500 mm; 200 μm (insets).
(C) Fluorescent images of brain sections from Cx3cr1YFP–CreER/+ (Litt) mice injected with TAM neonatally, immunolabeled with anti-P2RY12 (red) and anti-GFP to identify Cx3cr1YFP+ cells (green). Regions of the cortex devoid of anti-P2RY12 immunofluorescence (dotted outline in inset) contain Cx3cr1YFP+ cells with a morphology characteristic of reactive microglia. Scale bars, 500 μm; 100 μm (insets).
(D) Diagram of experimental protocol used to assess the effect of TAM injection at P28 on anti-P2RY12 immunofluorescence in Cx3cr1YFP–CreER/+ (Litt);Rosa26mTmG/+ mice.
(E and F) Fluorescent images of brain sections from Cx3cr1YFP–CreER/+ (Litt);Rosa26mTmG/+ mice used for flow cytometry analysis in Figure 1, immunolabeled with anti-P2RY12 (imaged using AF647). No patches are devoid of anti-P2RY12 immunofluorescence. Scale bars, 500 μm (E); 200 μm (F).
(G) Quantification of the percentage of mice with patches devoid of anti-P2RY12 immunofluorescence shows higher prevalence in Cx3cr1YFP–CreER/+ (Litt) mice injected with TAM as neonates vs. Cx3cr1YFP–CreER/+ (Litt) mice injected with TAM at P28 (chi-squared test: n = 4, 4 mice; **p < 0.01).
(H) Diagram of experimental protocol used to perform RNA sequencing on Cx3cr1YFP–CreER/+ (Litt) mice injected with TAM or oil at P28.
(I) Smear plot of TAM-vs. oil-injected Cx3cr1YFP–CreER/+ (Litt) mice depicting log fold change (FC) on the y axis against log counts per million (CPM) on the x axis (n = 4, 5 mice). Differentially expressed genes with false discovery rate (FDR) < 0.05 are annotated in red (upregulated by TAM) or blue (downregulated by TAM).
See also Figure S4.
