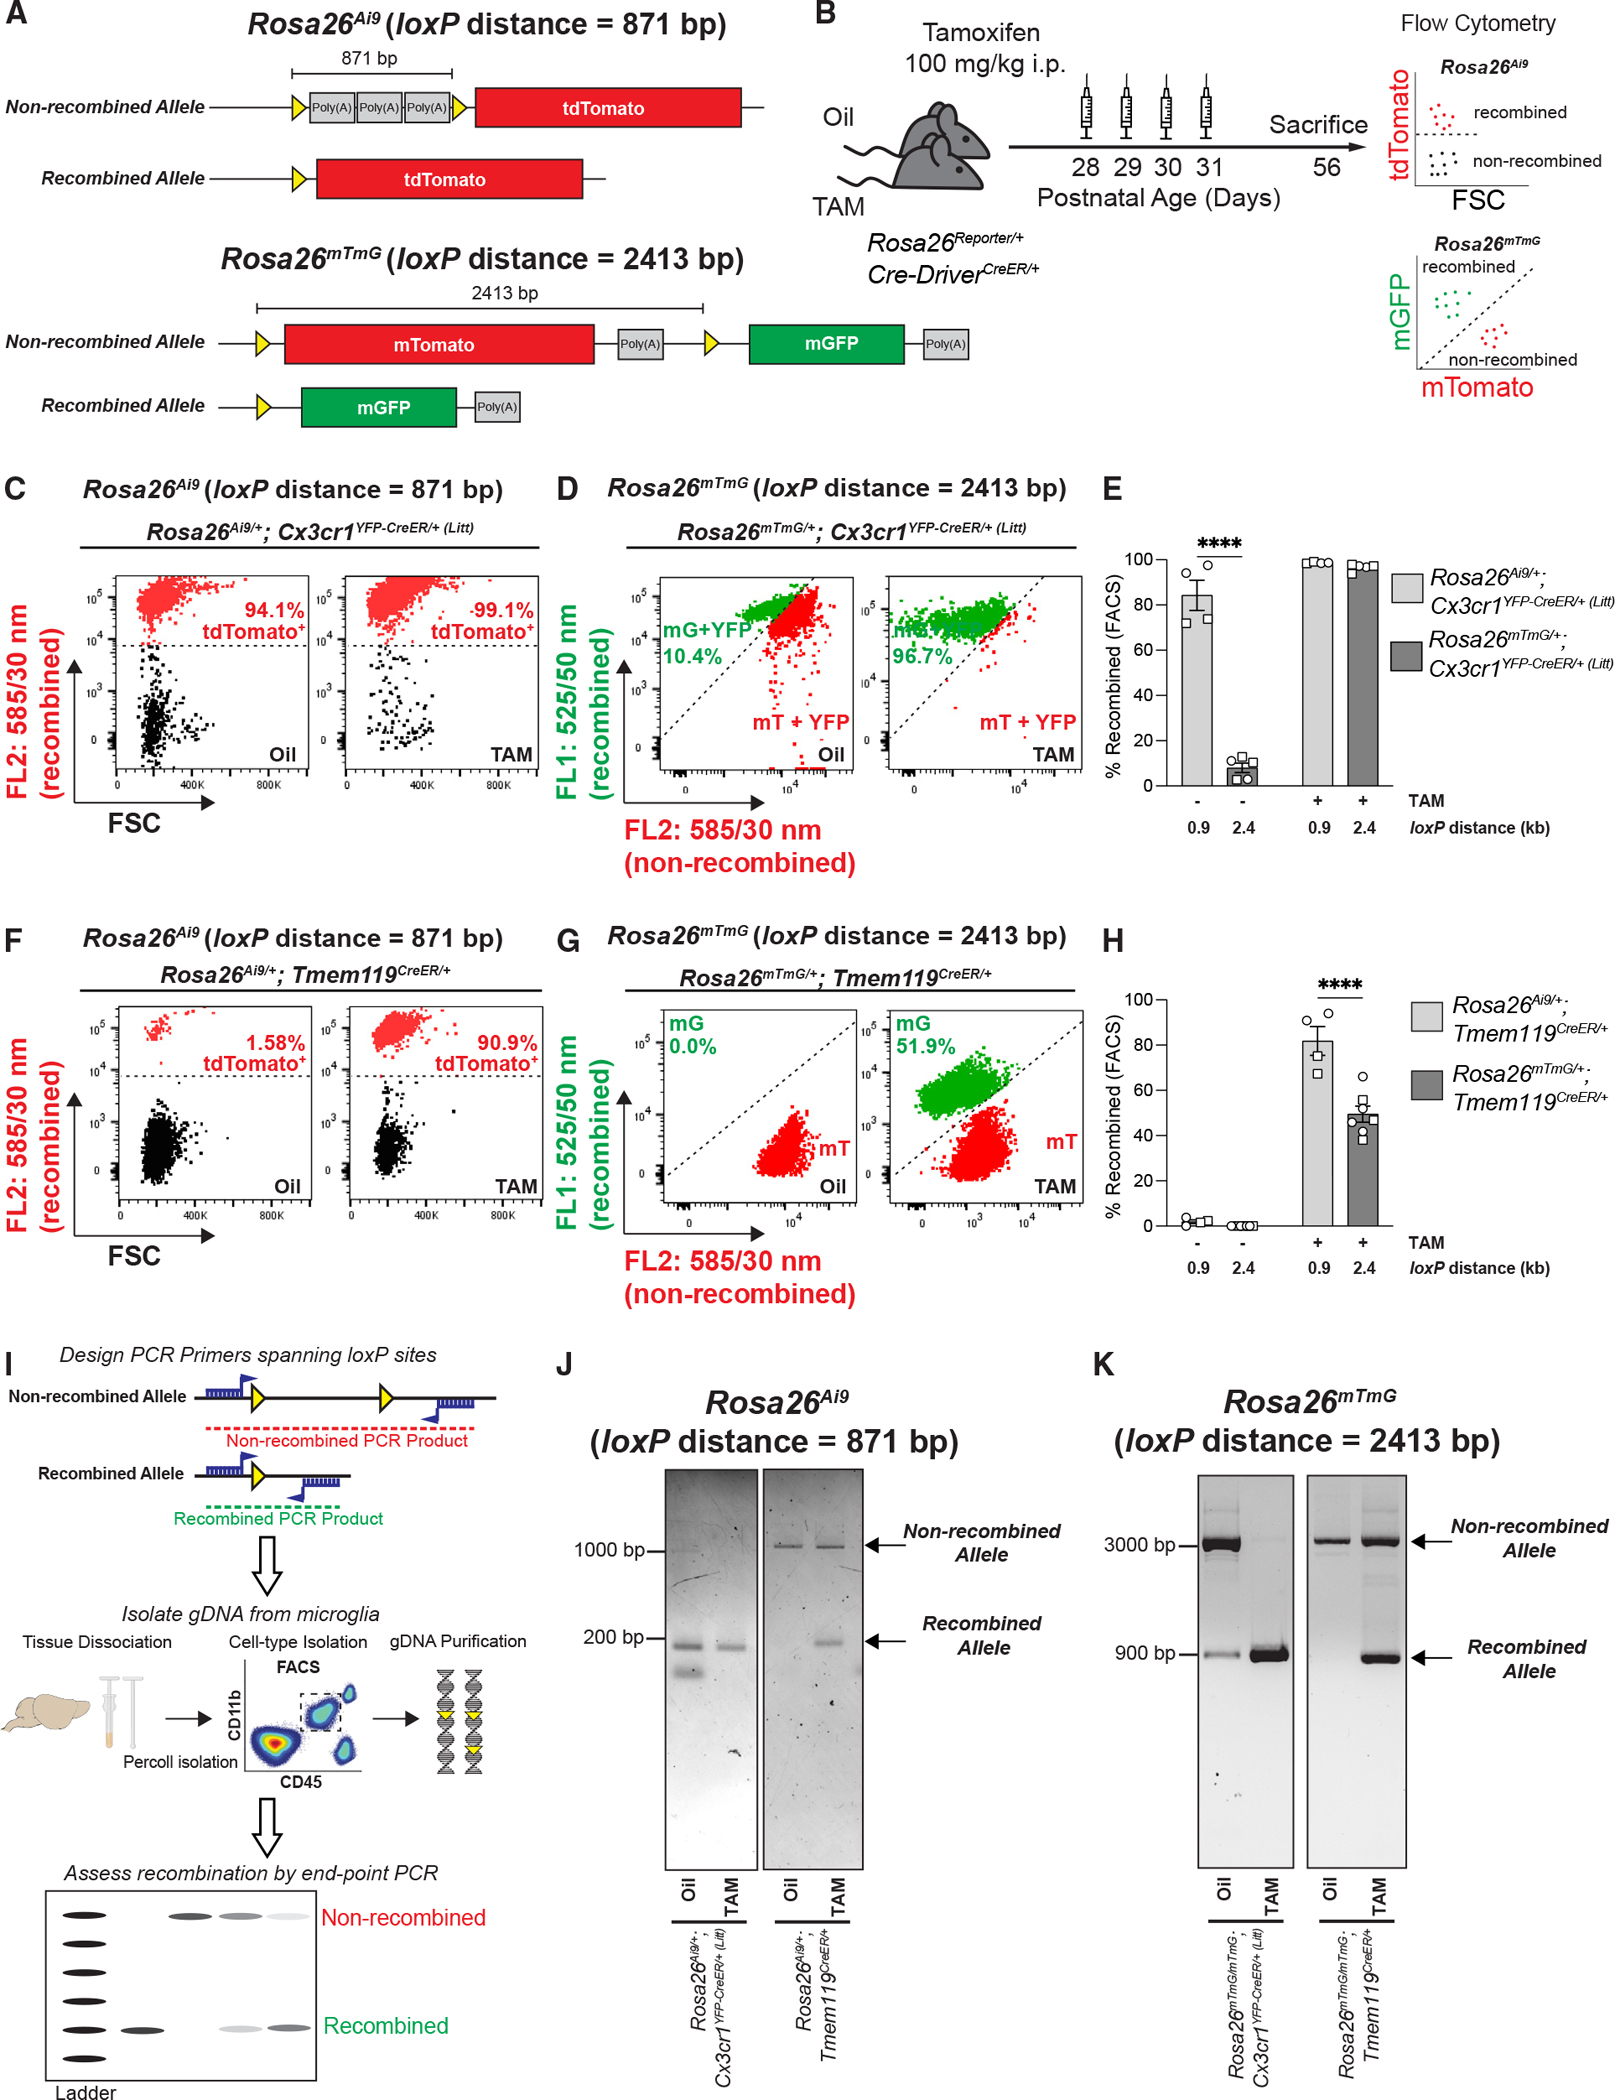
Figure 6. Inter-loxP distance is a determinant of recombination efficiency in microglial CreER lines.

(A) Diagram of the Rosa26Ai9 allele and Rosa26mTmG allele before and after Cre/loxP recombination shows the locations of the loxP sites (yellow triangles) and the inter-loxP distance.
(B) Diagram of experimental protocol used to assess TAM-induced Cre/loxP recombination of Rosa26Ai9 and Rosa26mTmG in microglia by flow cytometry.
(C, D, F, and G) Representative flow cytometry results from individual oil- and TAM-injected Cx3cr1YFP–CreER/+ (Litt) and Tmem119CreER/+ mice expressing Rosa26Ai9/+ are compared with flow cytometry results of Rosa26mTmG/+ from Figure 1. Recombined Rosa26Ai9 microglia are tdTomato+, whereas recombined Rosa26mTmG microglia are mGFP+ (mG) and non-recombined Rosa26mTmG microglia are mTomato+ (mT).
(E and H) Quantifications of recombination of Rosa26Ai9 and Rosa26mTmG in microglia from oil- and TAM-injected mice show significantly more recombination of the 0.9 kb Rosa26Ai9 floxed allele vs. the 2.4 kb Rosa26mTmG floxed allele in (E) Cx3cr1YFP–CreER/+ (Litt) mice (two-way ANOVA with Sidak’s post hoc test; n = 4 Rosa26Ai9 oil, 5 Rosa26mTmG oil, 4 Rosa26Ai9 TAM, and 5 Rosa26mTmG mice; ****p < 0.0001) and (H) Tmem119CreER/+ mice (two-way ANOVA with Sidak’s post hoc test; n = 4 Rosa26Ai9 oil, 8 Rosa26mTmG oil, 4 Rosa26Ai9 TAM, and 7 Rosa26mTmG mice; ****p < 0.0001).
(I) Diagram of protocol to assess Cre/loxP recombination in microglia by endpoint PCR of genomic DNA (gDNA).
(J and K) Gel images of endpoint PCR products from microglial gDNA isolated by florescence-activated cell sorting (FACS) from oil- and TAM-injected Cx3cr1YFP–CreER/+ (Litt) and Tmem119CreER/+ mice expressing Rosa26Ai9/+ or Rosa26mTmG/+.
All data are presented as mean ± SEM. Individual data points indicate males (squares) and females (circles). See also Figure S6.
