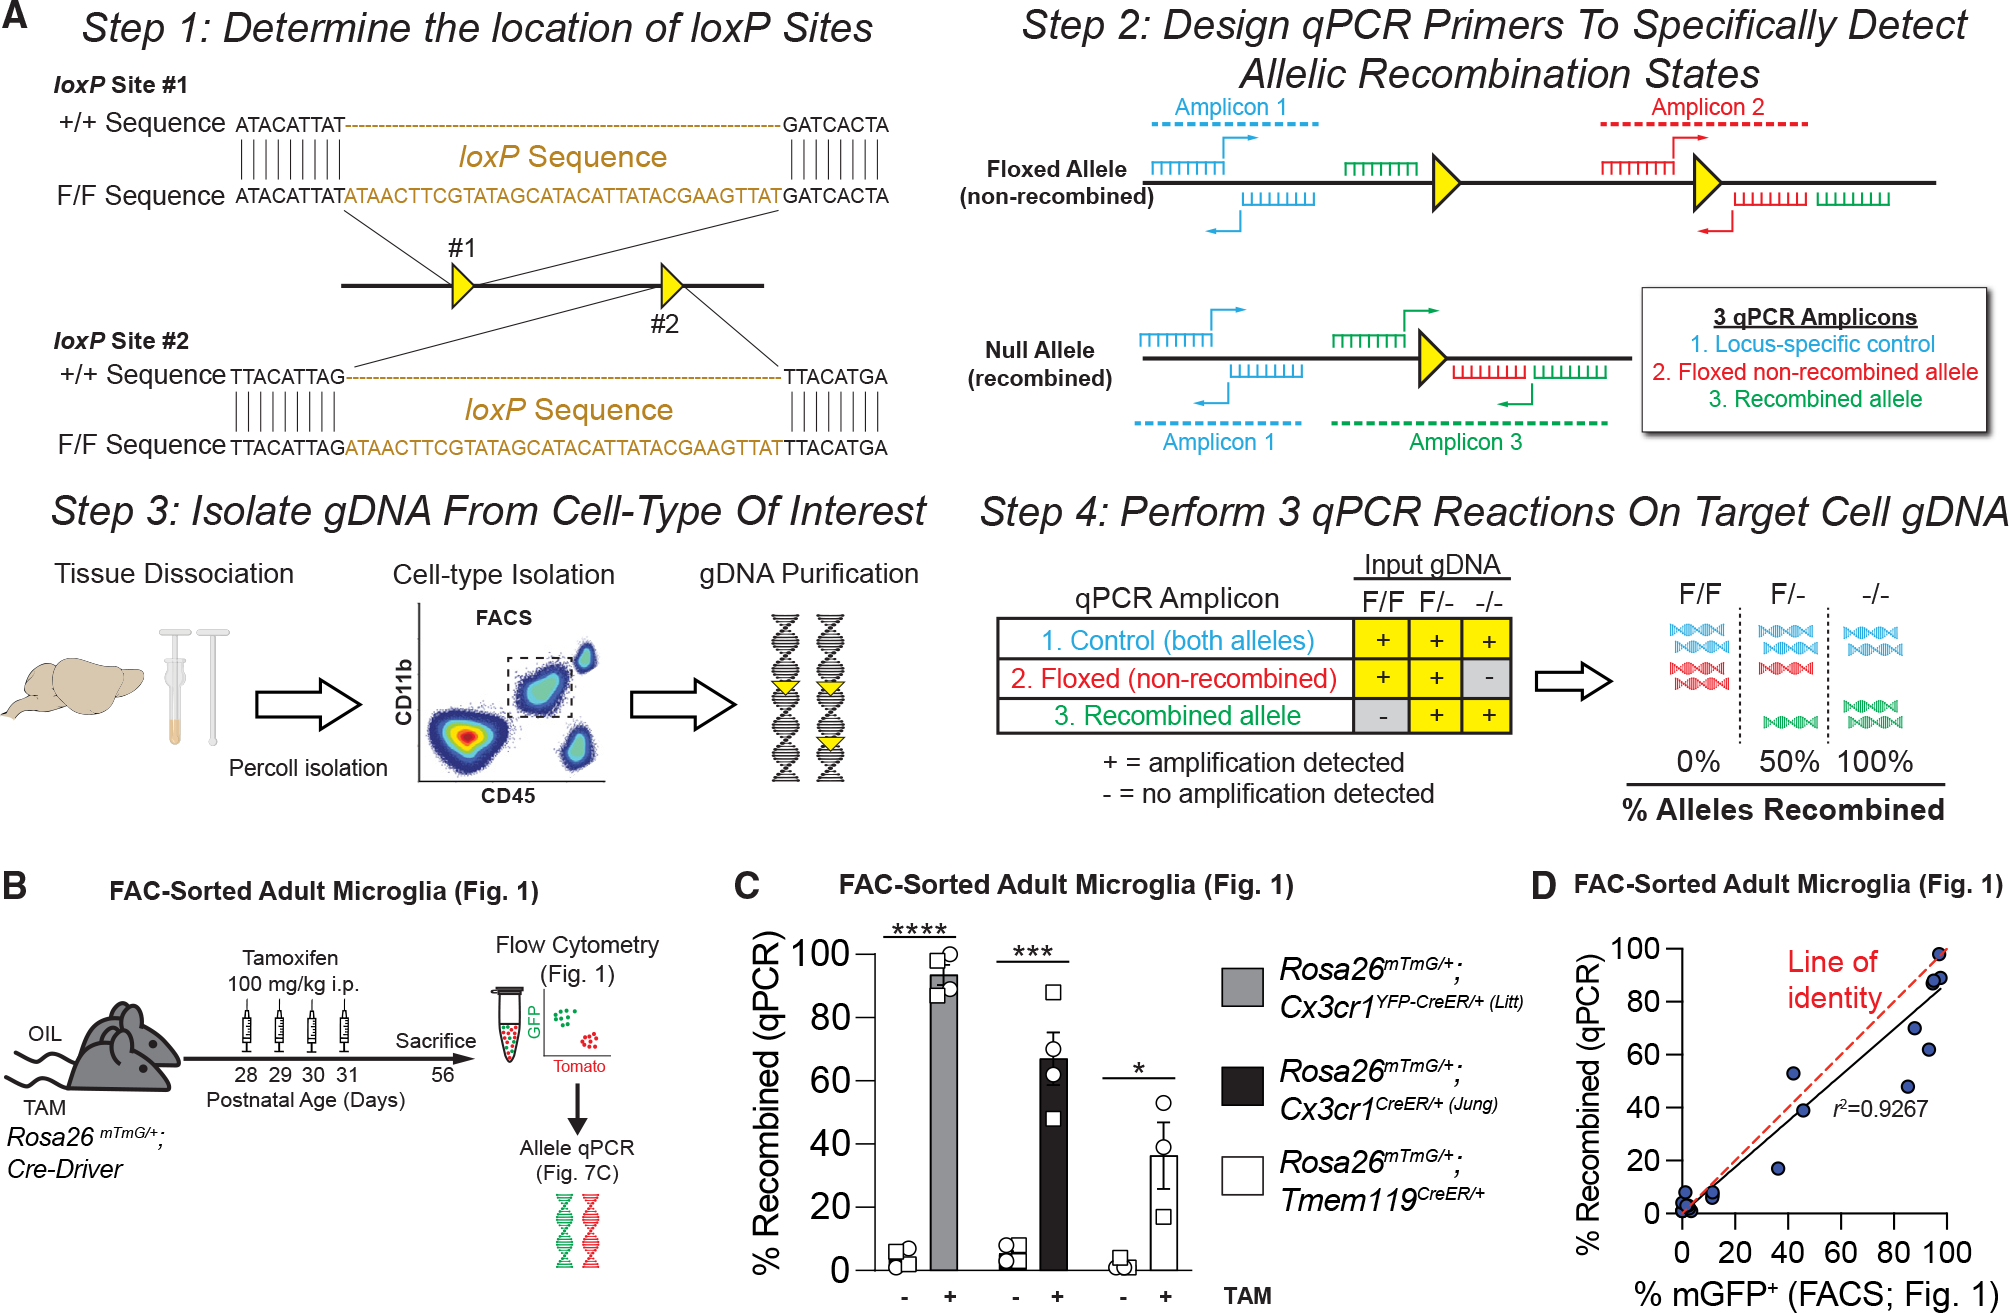
Figure 7. A quantitative PCR (qPCR) protocol to quantitatively assess recombination in microglia.

(A) Diagram of protocol used to quantify Cre/loxP recombination of microglial gDNA by qPCR.
(B) Diagram of experiment to assess Cre/loxP recombination in mice injected with TAM or oil.
(C) Quantification of the percentage of recombined gDNA by qPCR shows increased recombination in TAM vs. oil for all three CreER lines (Rosa26mTmG/+;Cx3cr1YFP–CreER/+ (Litt): Student’s t test, n = 4 oil, 4 TAM mice; Cx3cr1CreER/+ (Jung): Student’s t test, n = 4 oil, 4 TAM mice; Tmem119CreER/+: Student’s t test, n = 4,oil, 3 TAM mice; *p < 0.05, ***p < 0.001, ****p < 0.0001).
(D) Graph of percent recombination of Rosa26mTmG in microglia in mice injected with TAM or oil as measured by flow cytometry analysis (see also Figure 1) vs. the recombination rate as measured by qPCR of microglial gDNA isolated by FACS. Data points fit to a linear curve (black line; r2 = 0.9267), closely aligned with the line of identity (red dashed line), indicating that qPCR provides a linear, quantitative measurement of Rosa26mTmG recombination in in vivo samples.
Data in (C) are presented as mean ± SEM. Individual data points in (C) indicate males (squares) and females (circles). See also Figure S7.
