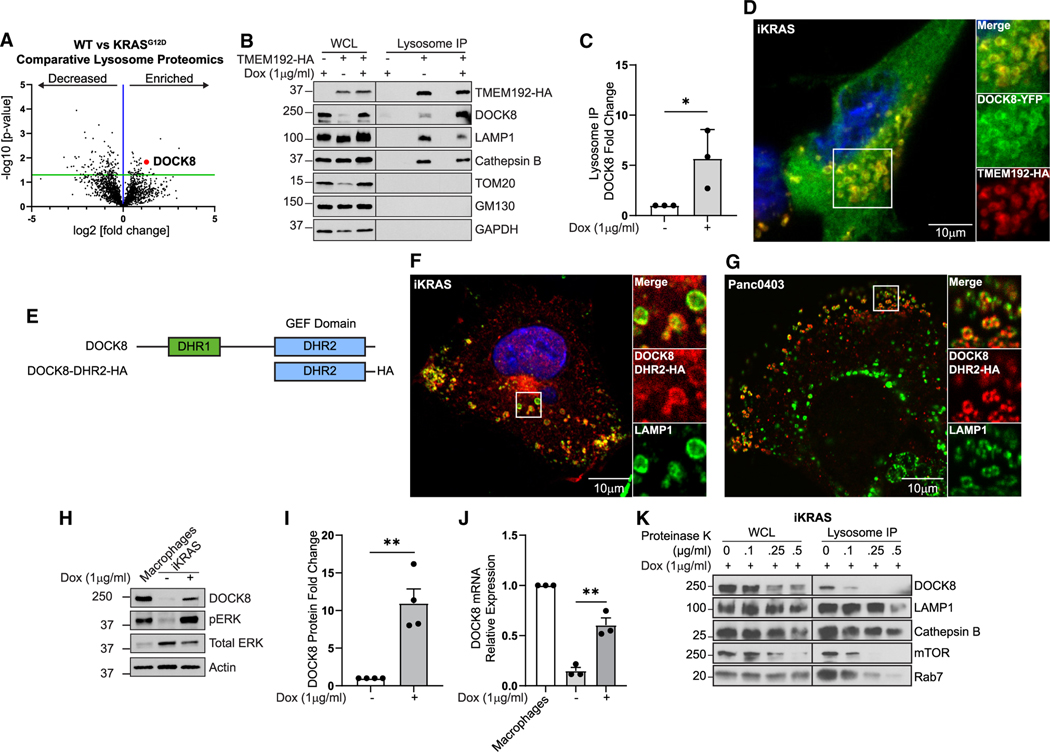
Figure 1. Lysosome proteomics reveal that DOCK8 is regulated by oncogenic KRASG12D.
(A) Comparative proteomics of lysosomes isolated from iKRASG12D cells ± doxycycline (KRASG12D versus WT), showing enrichment of 57 proteins (right of blue line) and decrease of 138 proteins (left of blue line) on lysosomes from KRASG12D-expressing cells. Red point: DOCK8.
(B) DOCK8 associates with lysosomes. Immunoblotting of whole-cell lysates (WCLs) and isolated lysosomes from control iKRASG12D, or iKRASG12D-TMEM192-HA cells ± doxycycline, indicating enrichment of DOCK8 in cells expressing KRASG12D. LAMP1 and cathepsin B: lysosomal positive controls; TOM20, GM130, and GAPDH: negative controls.
(C) Quantitation of DOCK8 immunoblotting on isolated lysosomes from KRASG12D normalized to WT cells.
(D) Immunofluorescence of iKRASG12D-TMEM192-HA cells + doxycycline showing DOCK8-YFP (green) localization to TMEM192-HA (red) lysosomes.
(E) DOCK8 protein schematic, including DHR1 (green) and DHR2 (blue) domains, and a truncated mutant containing the DRH2 domain with HA tag (DOCK8-DHR2-HA).
(F and G) Immunofluorescence of iKRASG12D cells + doxycycline (F) and Panc04.03 cells (G) showing DOCK8-DHR2-HA (red) colocalization with LAMP1 (green) lysosomes.
(H) Oncogenic KRASG12D increases DOCK8 expression. Immunoblotting of DOCK8 in cell lysates from iKRASG12D cells ± doxycycline. RAW 264.7 macrophages: positive control.
(I) Quantitation of DOCK8 immunoblotting normalized to actin, compared to KRASWT cells.
(J) Relative DOCK8 mRNA levels by qRT-PCR from iKRASG12D cells ± doxycycline, normalized to RAW 264.7 macrophages.
(K) Isolated lysosomes were treated with the indicated concentrations of Proteinase K. Intraluminal proteins cathepsin B and LAMP1 (intraluminal epitope) are protected from degradation, whereas proteins at the lysosomal surface (DOCK8, mTOR, Rab7) are sensitive to digestion. Scale bars, 10 μm.
Graphs: mean ± SEM of at least three independent biological replicates. Student’s t test: *p < 0.05; **p < 0.01; ***p < 0.001; ****p ≤ 0.0001.
See also Figure S1.

