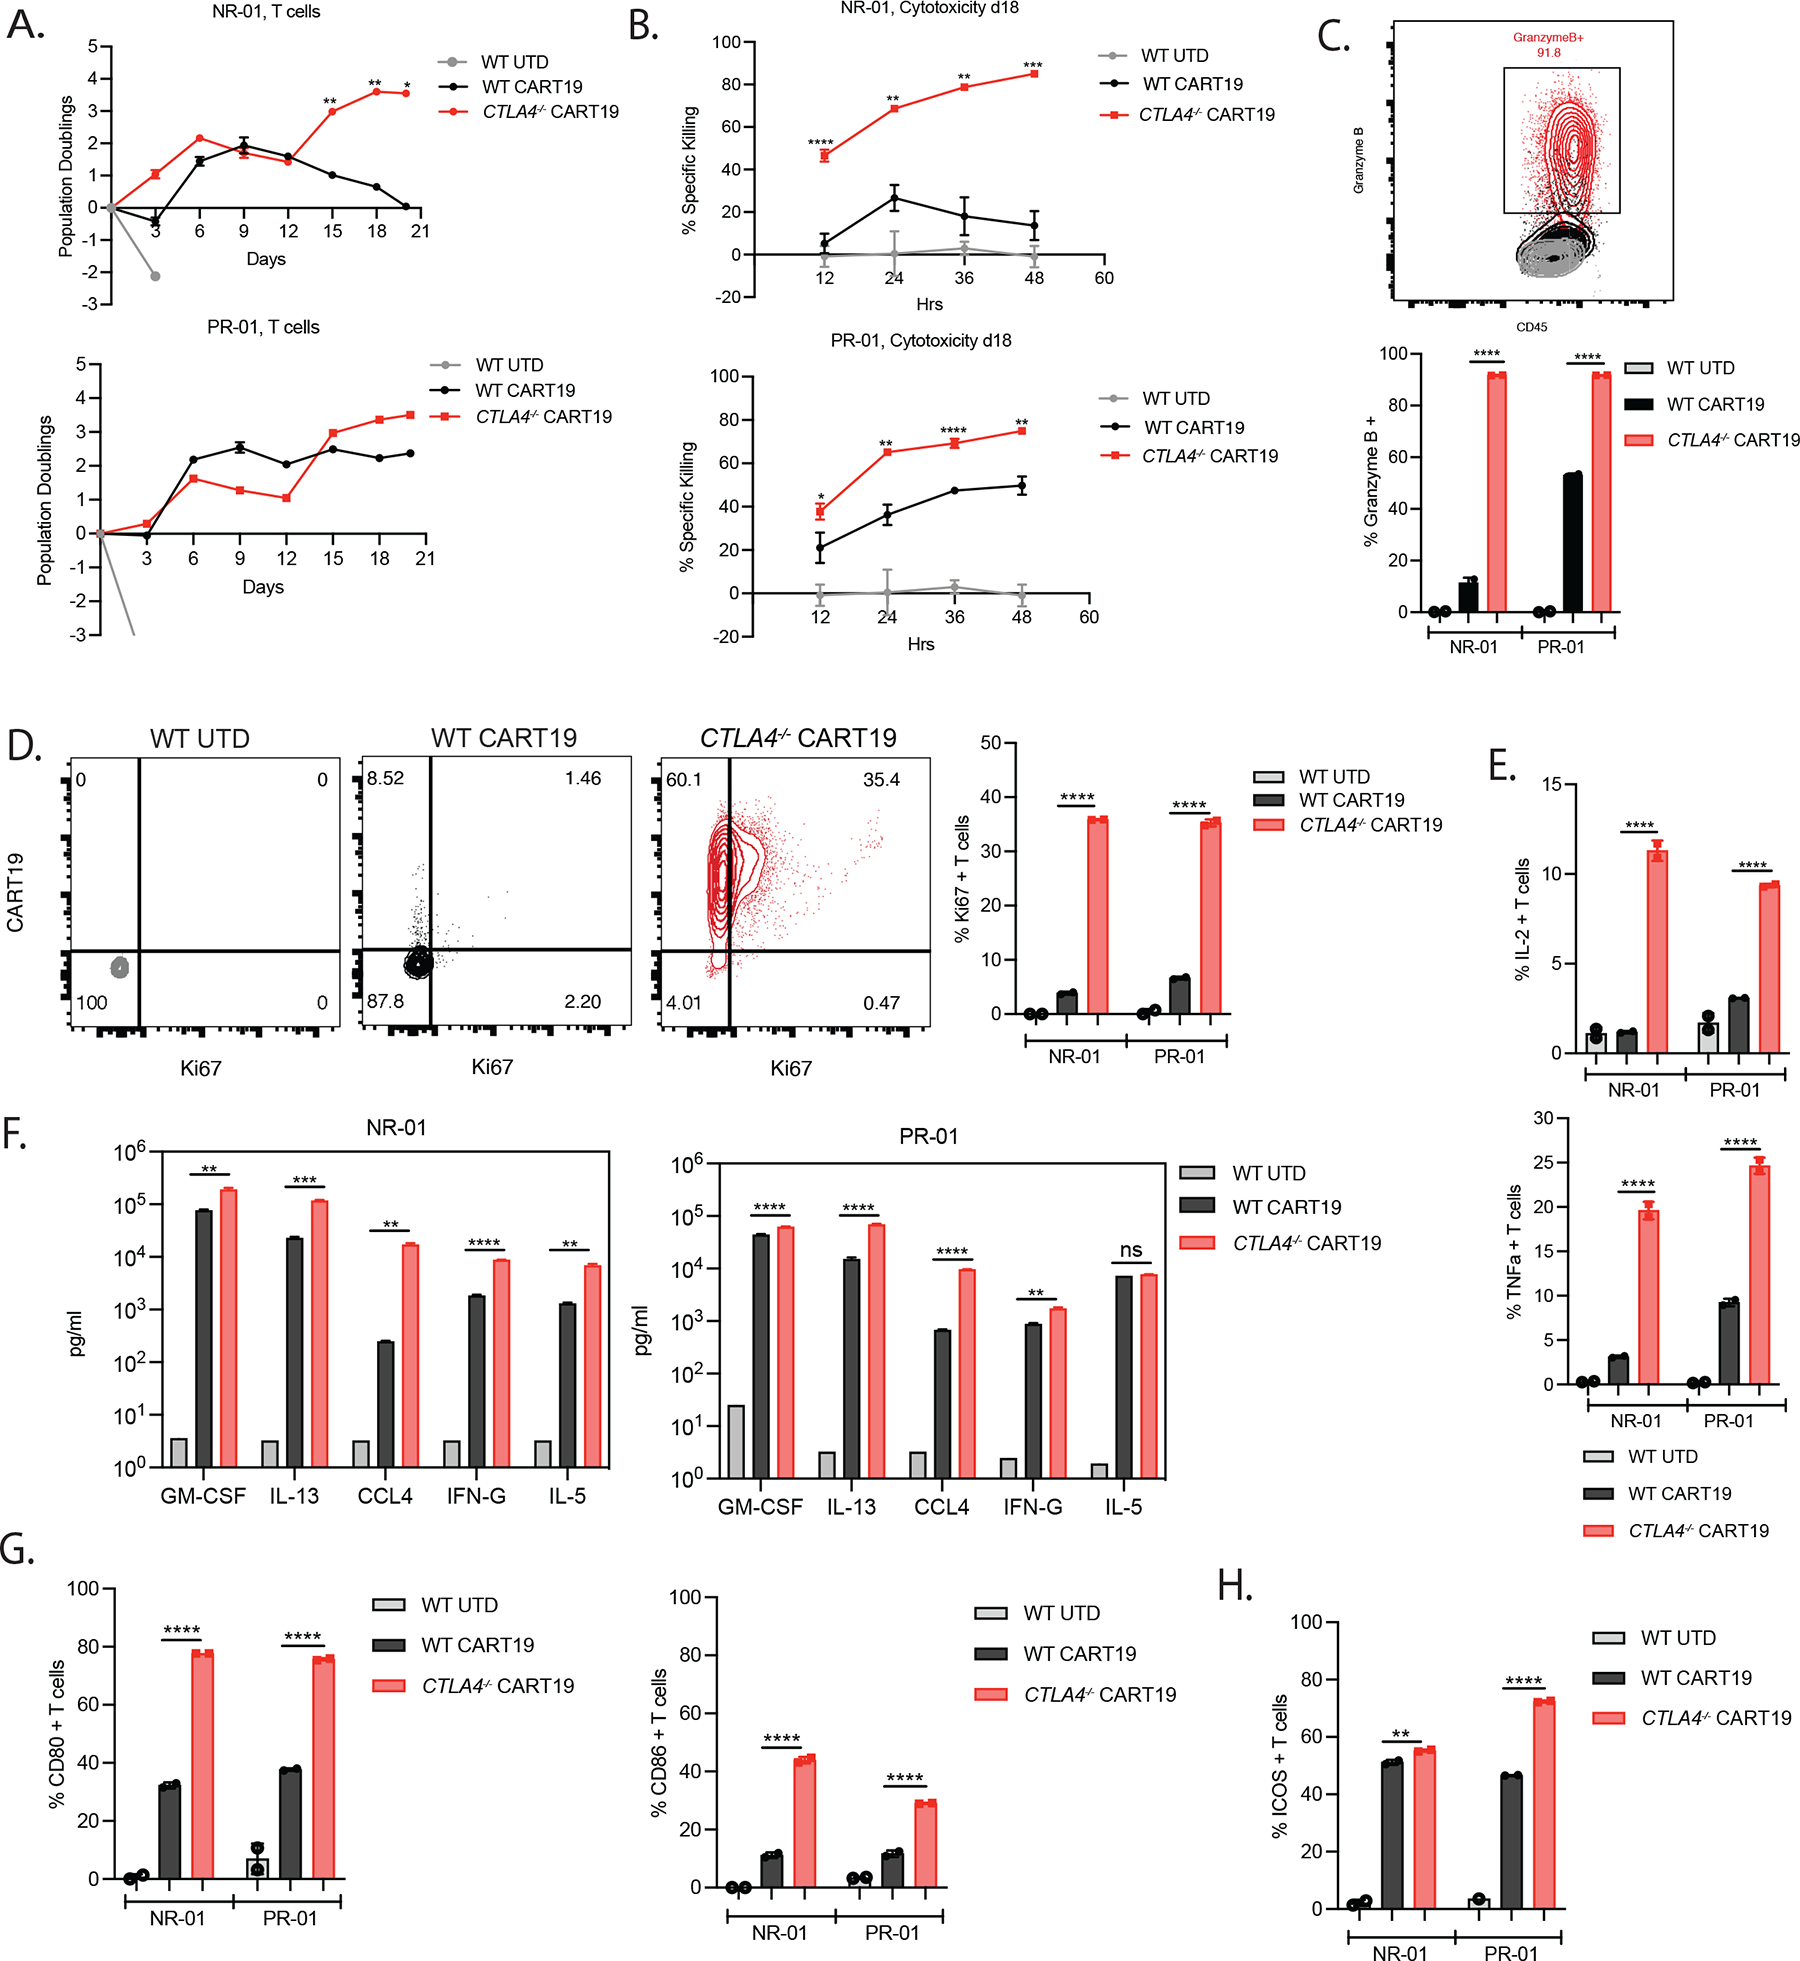
Figure 3. Deletion of CTLA-4 in T cells from non-responding CLL patients enables CART19 cells to clear tumor under stress-test conditions.

A. Population doublings of UTD T cells, WT, and CTLA-4-deficient CART19 cells during the in vitro CAE stress test quantified assessed by counting beads-based flow cytometry gated on CD45+ T cells. NR-01 (top) and PR-01 (bottom) CLL patients are shown.
B. Cytotoxicity assessment of surface CAR-normalized day 18 CAE CD45+ sorted WT, and CTLA-4-deficient CART19 and UTD T control cells from NR-01 and PR-01 CLL patients against fresh NALM6 target cells at a 1:2 E:T ratio.
C. Representative flow plot (top, NR-01) and quantification (bottom, NR-01 and PR-01) of granzyme B production by UTD T cells, WT and CTLA-4-deficient CART19 cells on day 18 of CAE stress test.
D. Representative flow plots (left, NR-01) and quantification (right, NR-01 and PR-01) of Ki67 production by UTD T cells, WT and CTLA-4-deficient CART19 cells on day 18 of CAE stress test.
E. Quantification of IL-2 (top) and TNFa (bottom) intracellular production levels in NR-01 and PR-01 CLL patients measured using flow cytometry on day 18 of the CAE stress test.
F. Concentration of cytokines in the supernatant from UTD T cells, WT, and CTLA-4-deficient CART19 cells from NR-01 and PR-01 CLL patients detected using 31-plex Luminex assay on day 18 of stress testing.
G. Frequency of CD45+ CD80+ and CD45+ CD86+ T cells from NR-01 and PR-01 CLL patients detected using flow cytometry on day 18 of the CAE stress test.
H. Frequency of CD45+ICOS+ T cells from NR-01 and PR-01 CLL patients assessed by flow cytometry on day 18 of the CAE stress test.
Error bars indicate mean±SD from technical replicates in one patient. NR-01 and PR-01 are shown separately. ns P > 0.05, * P ≤ 0.05, ** P ≤ 0.01, *** P ≤0.001, **** P ≤ 0.0001, by multiple unpaired t-tests with Bonferroni-Dunn correction for multiple comparisons. See also Figure S3.
