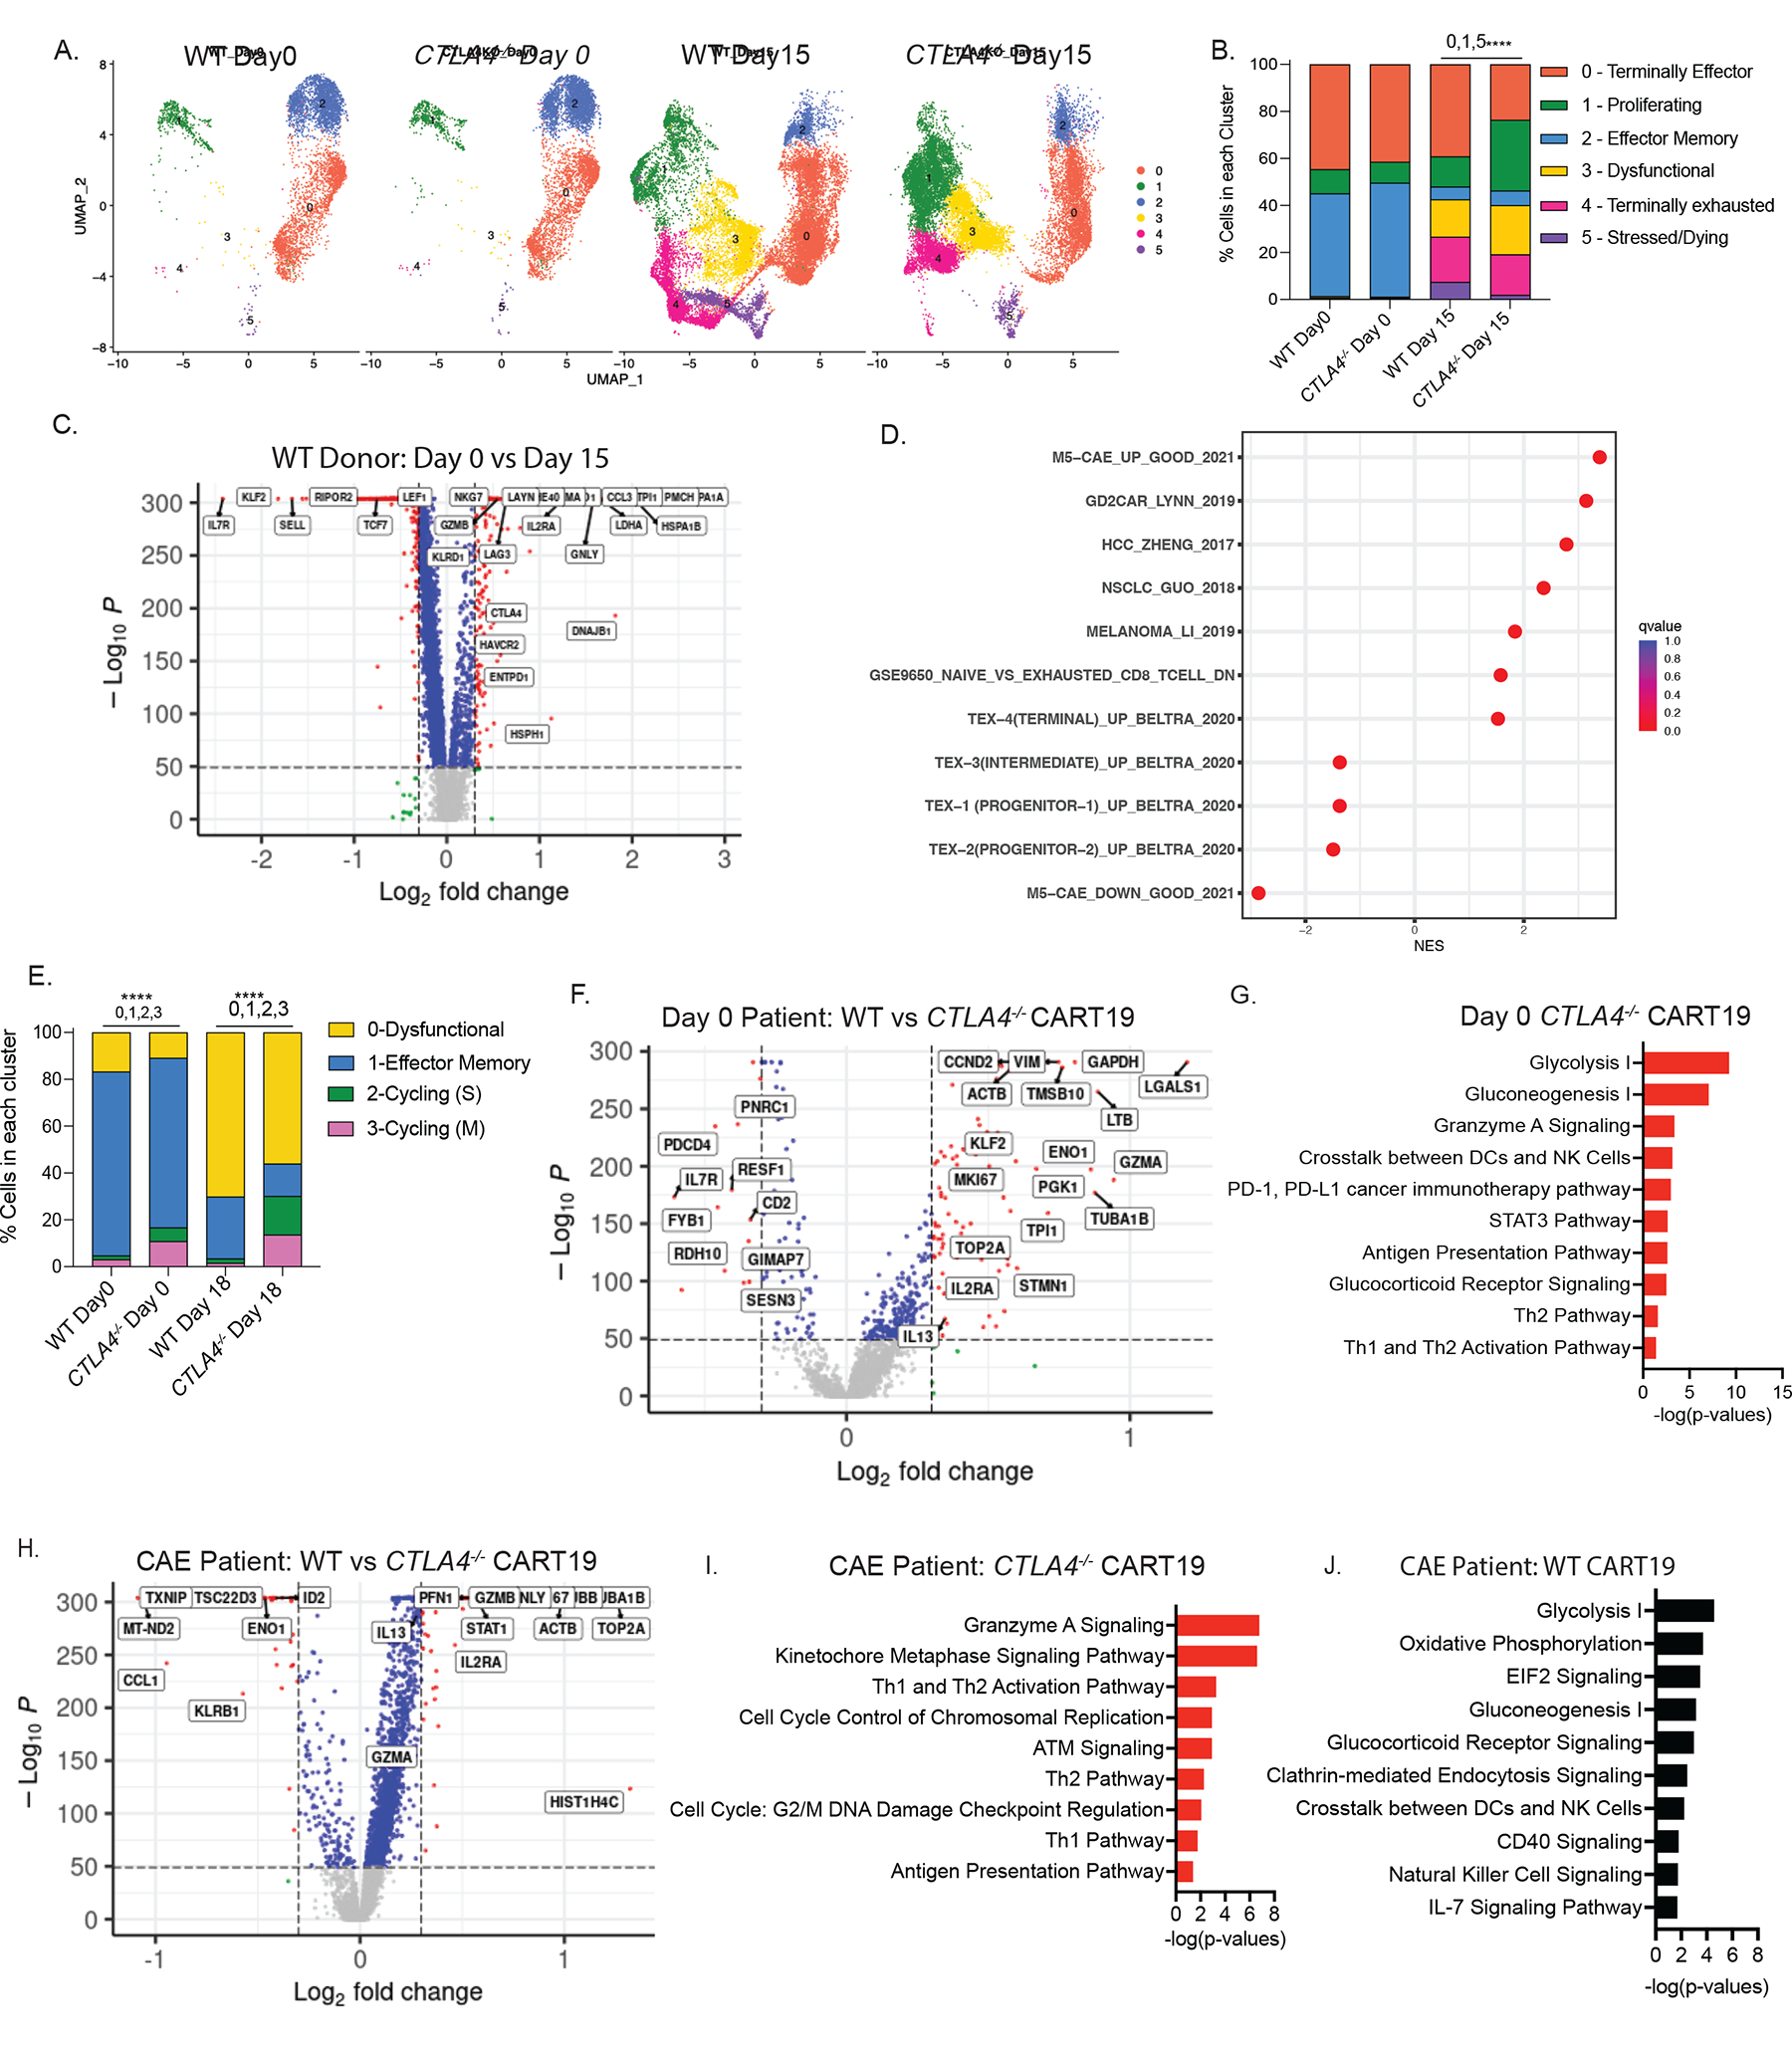
Figure 6. Transcriptional dynamics of CTLA4-deleted CART19 cells.

A. UMAP projection of scRNA-seq data on day 0 and on day 15 of stress testing of WT and CTLA-4-deficient CART19 cells, determined by Seurat v.4.1. Each dot corresponds to one individual cell. A total of 5 clusters were identified and color-coded (n=2 ND’s).
B. Bar plot showing percentage of cells in each cluster in WT and CTLA4-deleted CART19 cells on day 0 and day 15 (n=2 ND’s). Fisher’s exact test was used. Top 3 genes in each cluster are cluster 0 (CCL5, GZMK, KLRK1), cluster 1 (HIST1H4C, TOP2A, TUBA1B), cluster 2 (IL7R, KLF2, SELL), cluster 3 (CCL3, GNLY, GZMB), cluster 4 (PMCH, HSPA1A, HSPA1B), cluster 5 (BIRC3, MALAT1, HSP90AA1).
C. Volcano plot identifying the DEGs between day 0 (left) vs day 15 (right) WT CART19 cells. Genes upregulated in the day 15 WT CART19 are indicated on the right side. Red dots indicate genes with p < 1e-50 and log2FC >0.3 (n=2 ND’s). The x axis represents the log fold change; the y axis represents the log10 adjusted p values. A two-sided Wilcoxon rank sum test was used.
D. GSE analysis showing the enrichment of publicly available dysfunction and exhaustion datasets when considering all DEGs between day 15 WT CART19 CAE stress test vs day 0 WT CART19 product.
E. Bar plot showing percentage of cells in each cluster in WT and CTLA-4-deleted CART19 cells on day 0 and day 18 from NR-01 and PR-01 CLL patients. Fisher’s exact test was used. Top 3 genes in each cluster are cluster 0 (PMCH, GNLY, GZMB), cluster 1 (LTB, FTL, RPS28), cluster 2 (HIST1H4C, TOP2A, TUBA1B), cluster 3 (HIST1H1B, HMGN2, LGALS1).
F. Volcano plot identifying the DEGs between day 0 WT CART19 cells (left) and day 0 CTLA-4-deficient CART19 cells (right) from NR-01 and PR-01 CLL patients. Red dots indicate genes with log10 adjusted p values < 1e-50 and log2FC >0.3.). The x axis represents the log fold change; the y axis represents the log10 adjusted p values. A two-sided Wilcoxon rank sum test was used.
G. IPA of pathways upregulated at day 0 CTLA-4-deficient CART19 compared to day 0 WT CART19 cells shown as bar graphs. Top pathways were determined by using a significant p-value of <0.05 and pathways with a negative z-score were removed from analysis.
H. Volcano plot identifying the DEGs between WT CART19 cells (left) and CTLA-4-deficient CART19 cells (right) after day 18 of CAE stress from NR-01 and PR-01 CLL patients. Red dots indicate genes with p < 1e-50 and log2FC >0.3. The x axis represents the log fold change; the y axis represents the log10 adjusted p values. A two-sided Wilcoxon rank sum test was used.
I. IPA of pathways upregulated at day 18 CTLA-4-deficient CART19 compared to day 0 CTLA-4-deficient CART19 cells shown as bar graphs. Top pathways were determined by using a significant p-value of <0.05 and pathways with a negative z-score were removed from analysis.
J. IPA of pathways upregulated at day 18 WT CART19 compared to day 0 WT CART19 cells shown as bar graphs. Top pathways were determined by using a significant p-value of <0.05 and pathways with a negative z-score were removed from analysis. See also Figure S6 and Table S1–5.
