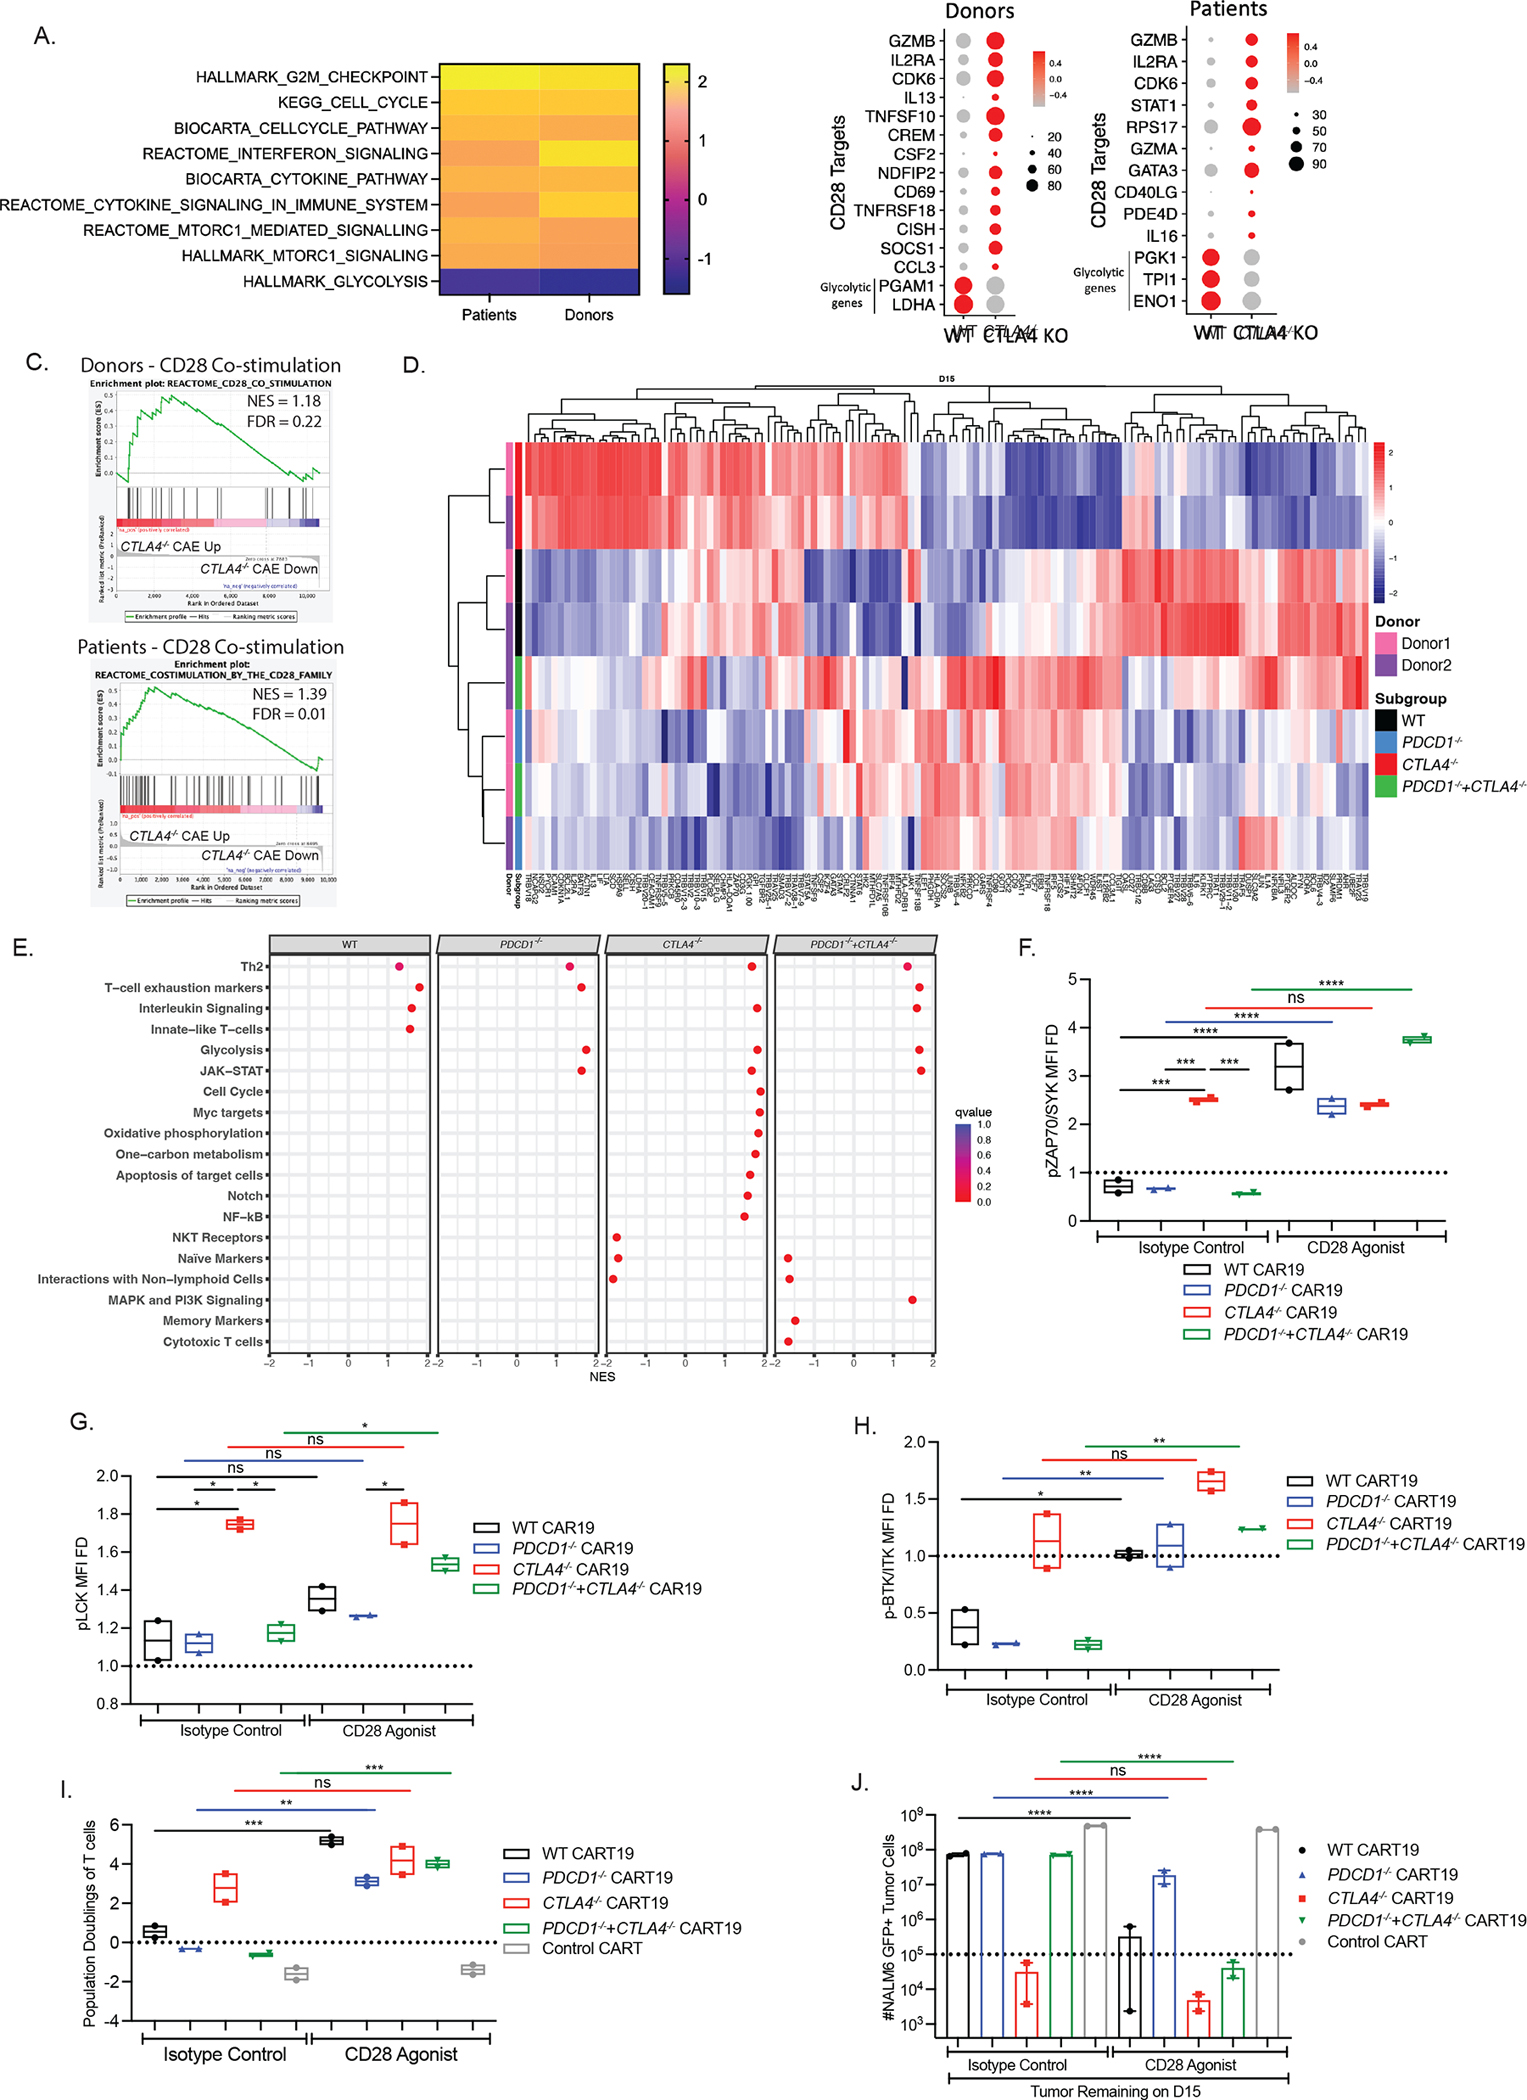
Figure 7. Uninhibited CD28 co-stimulation enhances the anti-tumor efficacy of CTLA-4-deficient CART19 cells.

A. GSE analysis of common pathways upregulated in CTLA4-deleted CART19 cells in ND and CLL patients showing normalized enrichment scores (NES).
B. Downstream targets of CD28 in CTLA-4-deficient CART19 cells after stress testing as predicted by IPA in both ND and CLL patients. Genes that are differentially expressed in stress tested WT and CTLA-4-deficient CART19 cells compared to day 0 WT and CTLA-4-deficient CART19 cells. Glycolytic genes are shown as controls.
C. GSE analysis showing positive enrichment of CD28 signaling in genes upregulated after stress testing CTLA4-deleted CART19 compared to WT CART19 cells from donors shown on the top; and genes upregulated at CAE CTLA4-deleted CART19 compared to CAE WT CART19 cells from CLL patients shown at the bottom (n=2 ND’s).
D. Heatmap depicting the normalized expression of top 130 DEGs between day 15 of the CAE stress test vs day 0 product in WT CART19 cells and PDCD1- and/ or CTLA4-deleted CART19 cells using nCounter-based readout (n=2 ND’s).
E. Dotplot of the NES scored by GSEA showing the significantly enriched pathways when considering all DEGs between day 15 CAE stress test vs day 0 product in each group using nCounter-based readout (n=2 ND’s).
F. MFI FD of phospho-ZAP70 (normalized to unstimulated T cells) in WT and edited BBz CART19 cells in the presence or absence of CD28 agonist at the end of the CAE stress test quantified by flow cytometry gated on CD45+ T cells (n=2 ND’s).
G. MFI FD of phospho-LCK (normalized to unstimulated T cells) in WT and edited BBz CART19 cells in the presence or absence of CD28 agonist at the end of the CAE stress test quantified by flow cytometry gated on CD45+ T cells (n=2 ND’s).
H. MFI FD of phospho-BTK/ITK (normalized to unstimulated T cells) in WT and edited BBz CART19 cells in the presence or absence of CD28 agonist at the end of the CAE stress test quantified by flow cytometry gated on CD45+ T cells (n=2 ND’s).
I. Population doublings of WT and edited BBz CART19 cells in the presence of CD28 agonist at the end of the CAE stress test quantified by using counting beads-based flow cytometry gated on CD45+ T cells (n=2 ND’s).
J. Total tumor burden remaining presence of CD28 agonist at the end of the CAE stress test quantified by using counting beads-based flow cytometry gated on GFP+ NALM6 target cells (n=2 ND’s).
Error bars indicate mean±SEM. ns P > 0.05, * P ≤ 0.05, ** P ≤ 0.01, *** P ≤0.001, **** P ≤ 0.0001, by ordinary one-way ANOVA with Bonferroni correction for multiple comparisons. See also Figure S7 and Table S6–7.
