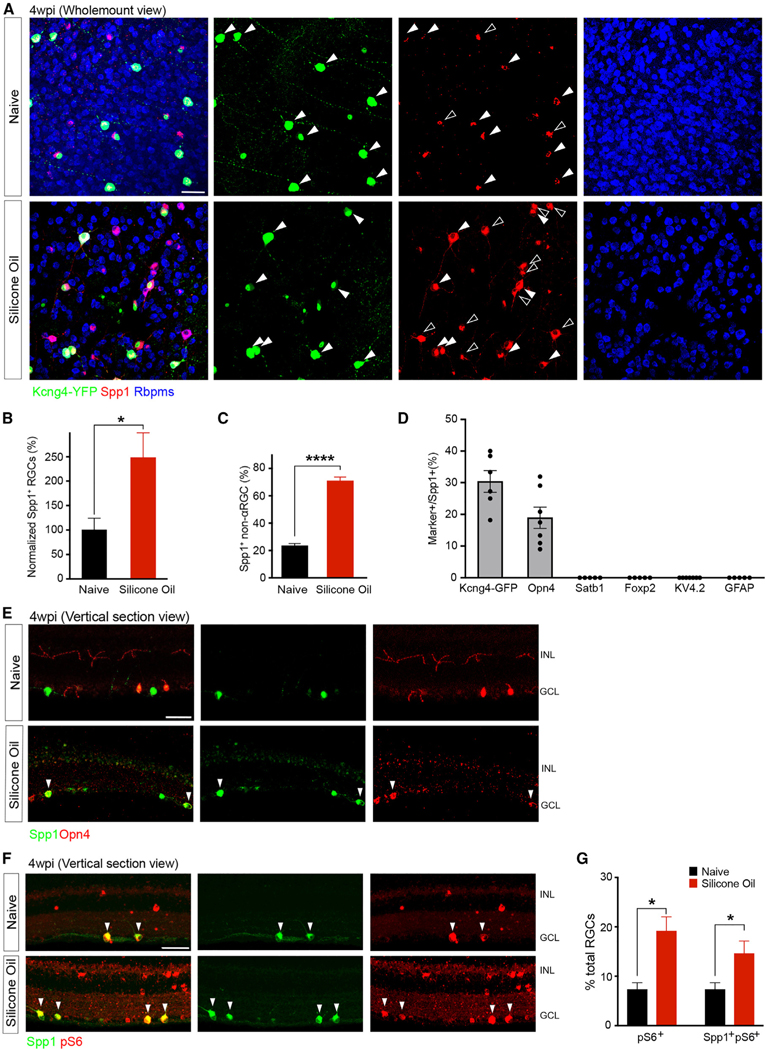
Figure 2. Resilient αRGCs and ipRGCs demonstrate elevated Spp1 expression after SOHU treatment.
(A) Representative retinal whole-mount images of Kcng4-YFP naive (top) and 4 wpi (bottom), labeled with antibodies to YFP (green), Spp1 (red), and Rbpms (blue). Arrows indicate the overlap of Spp1 and YFP; empty arrowheads indicate ectopic Spp1 expression, which is YFP negative. However, all Spp1 expression is restricted in Rbpms cells, indicating a restricted expression of Spp1 in RGCs.
(B) Quantifications of Spp1-positive RGCs numbers in both conditions indicating a significant increase of ectopic Spp1 expression, with the results being normalized to the naive group. n = 5 animals per condition.
(C) Quantification of the proportion of non-α-type RGC numbers exhibiting ectopic expression of Spp1 to the number of RGCs positive for Spp1. n = 5 animals per condition.
(D) Quantifications of the overlap between Spp1 and other markers for RGC subclasses (representative images shown in Figures S2A–S2E). n = 5–7 animals per condition.
(E) Vertical section of the naive retina (top) and 4 wpi (bottom), labeled with antibodies to Spp1 and Opn4 (melanopsin). Arrows indicate the overlap of Spp1 andOpn4 under SO treatment. Green, Spp1; red, Opn4.
(F) Vertical section of Kcng4-YFP (αRGCs) naive retina (top) and 4 wpi (bottom), labeled with antibodies to pS6 and Spp1. Arrows indicate the overlap of Spp1 and pS6. Green, Spp1; red, pS6.
(G) Fractions of the number of RGCs that have high-pS6-positive levels in both conditions, while the majority of the pS6-positive increase is coupled with Spp1-positive elevation.
Scale bars (A, E, and F), 50 μm. n = 5 animals per condition. Unpaired two-sided Student’s t tests; ****p < 0.0001; *p < 0.05.

