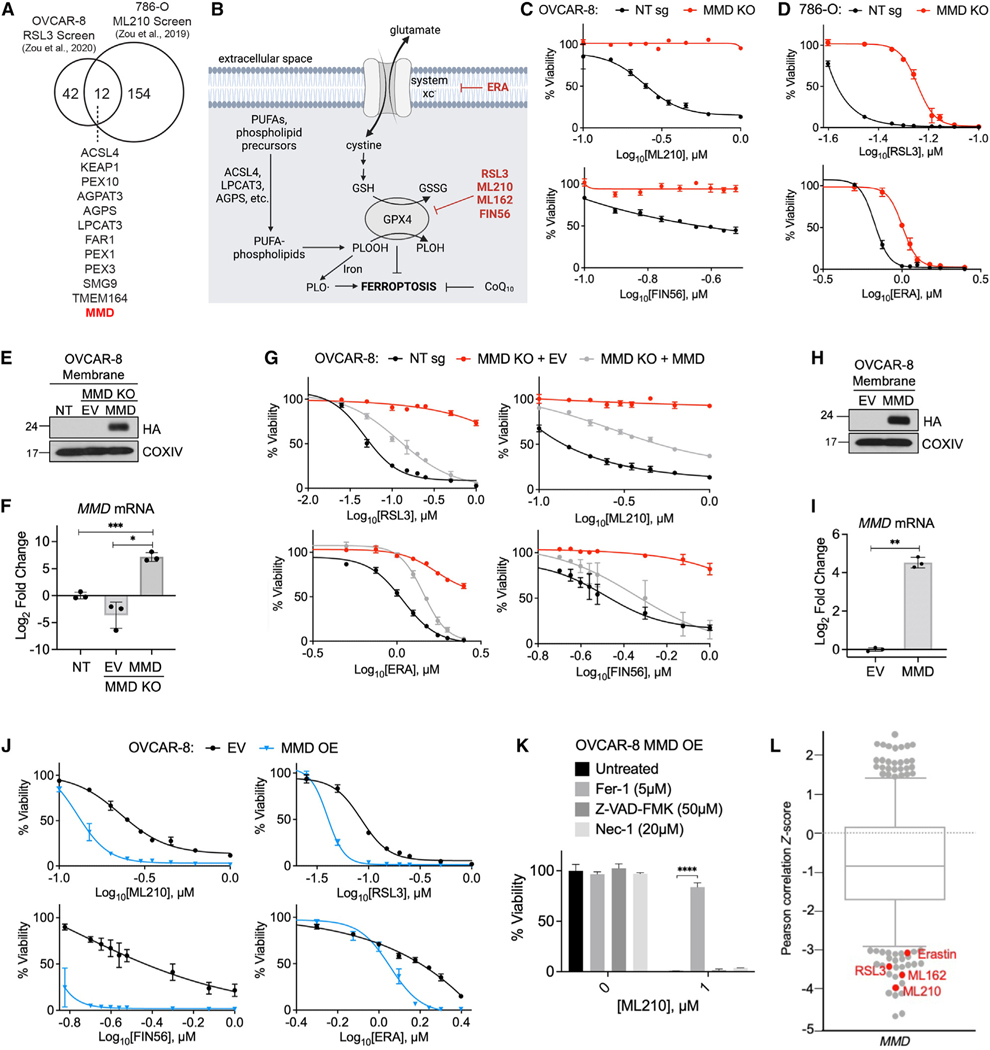
Figure 1. MMD promotes susceptibility to ferroptosis.
See also Figure S1.
(A) Venn diagram showing the 12 putative pro-ferroptosis genes identified in two previously published CRISPR screens. Data from Zou et al12
(B) Schematic of some key processes and proteins in ferroptosis; ferroptosis-inducing drugs in red.
(C) Viability of OVCAR-8 control (NT sg) and MMD KO cells in response to indicated concentrations of ferroptosis inducers.
(D) Viability of 786-O control (NT sg) and MMD KO cells in response to indicated concentrations of ferroptosis inducers.
(E) Immunoblot of membrane proteins in OVCAR-8 NT sg cells, MMD KO cells transduced with empty vector (MMD KO + EV), and MMD KO cells transduced withvector containing HA-MMD (MMD KO + MMD). COXIV was used as a loading control.
(F) RT-qPCR in OVCAR-8 MMD KO + EV and MMD KO + MMD cells, normalized to NT sg.
(G) Viability of OVCAR-8 NT sg, MMD KO + EV, and MMD KO + MMD cells in response to indicated concentrations of ferroptosis inducers.
(H) Immunoblot of membrane proteins in OVCAR-8 cells transduced with EV or vector containing HA-MMD (MMD). COXIV was used as a loading control.
(I) RT-qPCR in OVCAR-8 MMD OE cells, normalized to EV.
(K) Viability of OVCAR-8 EV and MMD OE cells in response to indicated concentrations of ferroptosis inducers.
(K) Viability of OVCAR-8 MMD OE cells in response to ML210 when treated concurrently with Fer-1, Z-VAD-FMK, Nec-1, or no drug (untreated).
(L) Boxplot in which each point represents the Z-scored Pearson correlation coefficient of expression of MMD with area under the viability curve for a distinct cytotoxic drug (481 drugs total) across 860 cancer cell lines. Boxplot interquartile range was set to ~0.75. Ferroptosis inducers with relatively low Z scores identified in red. Data from the Cancer Therapeutics Response Portal.
For cell viability curves, data points or bar graphs show mean ± SD of n = 3 biological replicates; for RT-qPCR graphs, individual data points are shown on a bar graph representing mean ± SD of n = 3 biological replicates; all experimental data are representative of three independent experiments. Statistical analyses by Student’s t test; ****p < 0.0001, ***p < 0.001, **p < 0.01, *p < 0.05.

