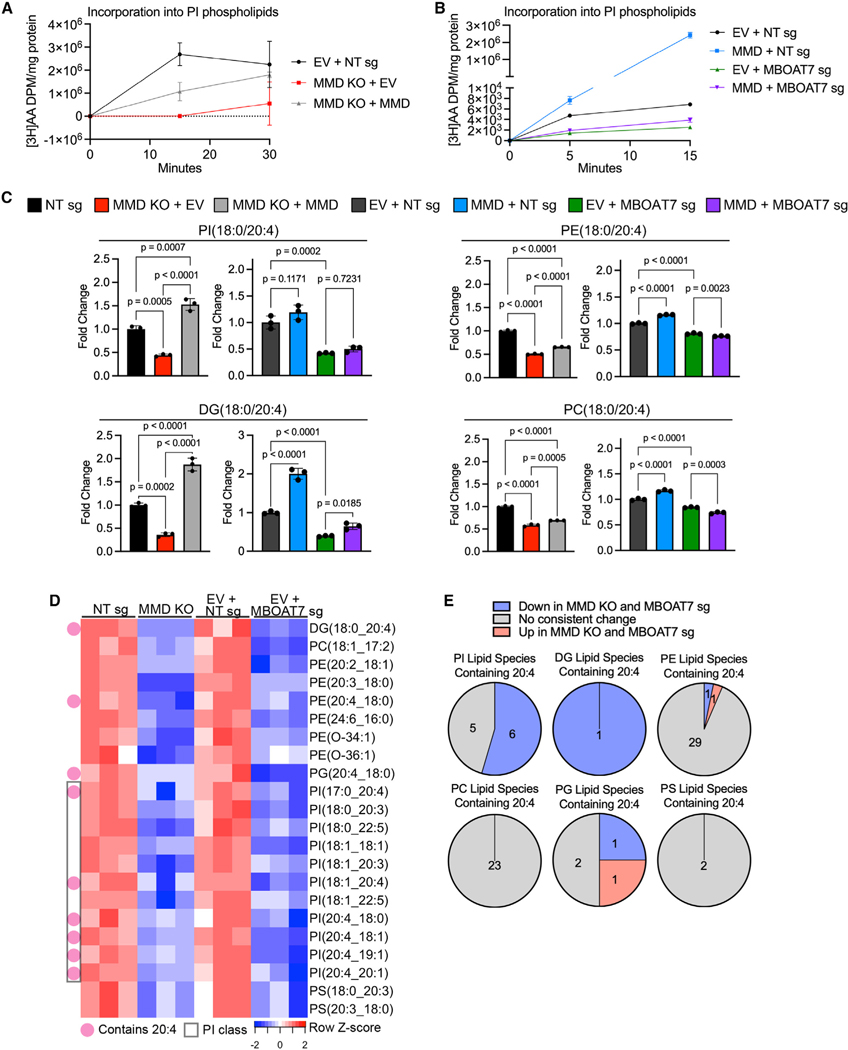
Figure 5. MMD directs the flux of AA into PI in an MBOAT7-dependent manner and generates putative pro-ferroptotic lipids.
See also Figure S5.
(A) Time course of [3H]AA content in PI phospholipids, normalized to total protein, in OVCAR-8 EV + NT sg (control), MMD KO + EV, and MMD KO + MMD cells. Data are from one independent experiment and show mean ± SD of n = 3 biological replicates.
(B) Time course of [3H]AA content in PI phospholipids, normalized to total protein, in OVCAR-8 EV + NT sg (control), MMD OE + NT sg, EV + MBOAT7 sg, and MMD OE + MBOAT7 sg cells (same cells as from Figure 4C). This experiment was conducted once, independently of the experiment in (A). Data show mean ± SD of n = 3 biological replicates.
(C) Barplots showing relative abundance of four out of six candidate pro-ferroptotic species identified by unbiased analysis of lipidomics data (see Figure S5B). Fold changes were normalized to the corresponding control cell line (NT sg for MMD KO + EV and MMD KO + MMD; EV + NT sg for MMD + NT sg, EV + MBOAT7 sg, and MMD + MBOAT7 sg). Individual data points are shown on a bar graph representing mean ± SD of n = 3 biological replicates. Statistical analyses by ordinary one-way ANOVA with Dunnett’s multiple comparisons test.
(D) Heatmap of candidate pro-ferroptotic species downstream of MMD and MBOAT7 based on unbiased analysis of another lipidomics dataset (see Figure S5C). Species are annotated as containing AA (20:4) or belonging to the PI subclass.
(E) Pie charts, by phospholipid subclass, showing proportions of lipid species containing AA that were consistently upregulated (red) or consistently down-regulated (blue) upon MMD or MBOAT7 depletion vs. those that did not consistently change (gray). Based on same lipidomics dataset analyzed in (D).

