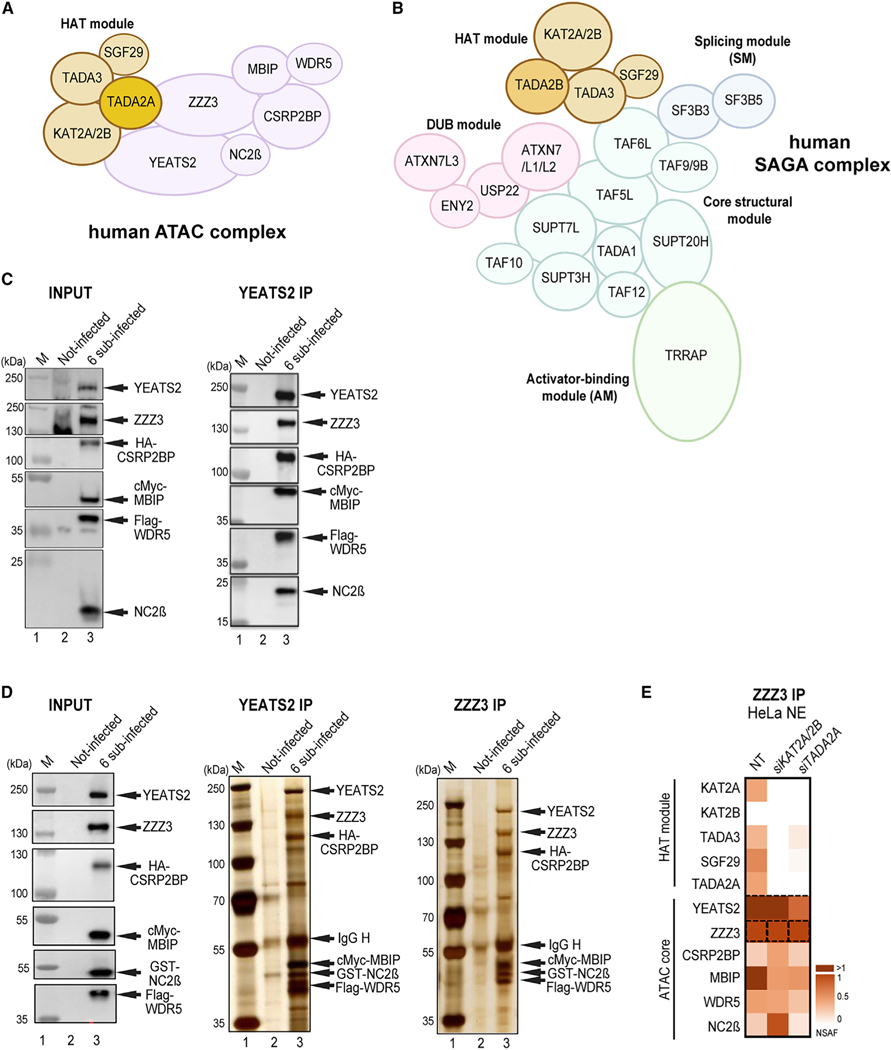
Figure 1. Schematic illustration of ATAC and SAGA complexes and pathways of co-TA assembly of protein partners.
(A) Illustration of the human ATAC complex with its four-subunit HAT module.
(B) Illustration of the human SAGA complex. The functional modules of SAGA, such as the HAT, the deubiquitinating (DUB), the core, the splicing (SM), and the activator-binding (AM) modules are indicated.
(C and D) Insect SF9 cells were either not infected (Not-infected) or co-infected with vectors expressing the six subunits of the recombinant ATAC complex (6 sub-infected): YEATS2, ZZZ3, HA-CSRP2BP, cMyc-MBIP, FLAG-WDR5, and NC2β (in C) or with YEATS2, ZZZ3, HA-CSRP2BP, cMyc-MBIP, FLAG-WDR5, and GST-NC2β (in D). 48 h post-infection, whole-cell extracts were made (INPUT), and anti-YEAST2 or anti-ZZZ3 IPs were carried out. The INPUT (in C and D), IPed, and peptide-eluted complexes were either tested by western blot analyses with the indicated antibodies (in C) or by silver staining of the 10% SDS-PAGE gels (in D). Molecular weight markers (Ms) are indicated in kDa. N = 2.
(E) HeLa cells were transfected with either siKAT2A/KAT2B (siKAT2A/2B), or siTADA2A siRNAs, or not (NT). 48 h post-transfection, NEs were prepared and an anti-ZZZ3 IP carried out. IPed endogenous ATAC subunits were analyzed by mass spectrometry. Three technical replicates (n = 3) were carried out, and normalized spectral abundance factor (NSAF) values were calculated (see also Table S3). NSAF values were normalized to the bait of the IP (ZZZ3). The normalized NSAF values are represented as heatmaps with the indicated scales. ATAC complex subunits and modules are indicated on the left.

