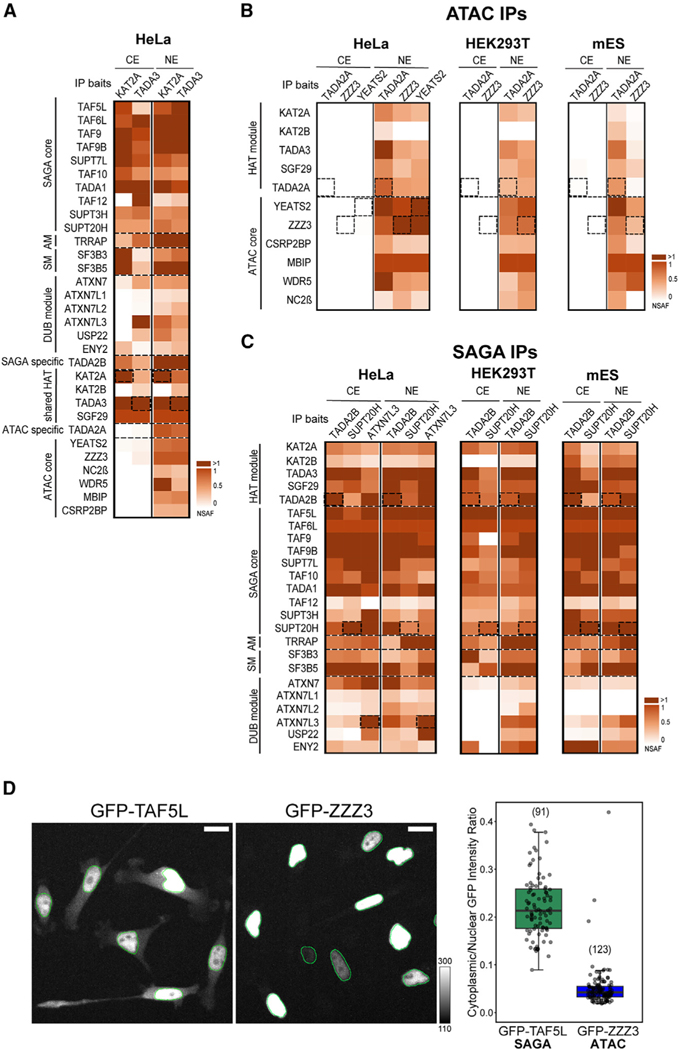
Figure 5. Human SAGA complex can be isolated from both nuclear and cytoplasmic compartments, while human ATAC is only detectable in the nucleus.
(A) Mass spectrometry analyses of KAT2A andTADA3 IPs carried out using either NEs or CEs (as indicated) prepared from human HeLa cells. NSAF values were calculated and normalized to SGF29 values.
(B) Mass spectrometry analyses of TADA2A, YEATS2, and ZZZ3 IPs carried out using NEs and CEs (as indicated) prepared from human HeLa cells (left) and of TADA2A and ZZZ3 IPs carried out using NEs and CEs prepared from either human HEK293T cells (middle) or mESCs (right). NSAF values were calculated and normalized to MBIP values in all NE IPs.
(C) Mass spectrometry analysis of TADA2B, SUPT20H, and ATXN7L3 IPs carried out using NEs and CEs (as indicated) prepared from either HeLa cells (left) or of TADA2B and SUPT20H IPs carried out using NEs and CEs prepared from either HEK293T cells (middle) or mESCs (right). NSAF values were calculated and normalized to TAF6L values in all IPs. In (A)–(C), three technical replicates were carried out per IP (n = 3; see also Table S4). NSAF values were calculated and normalized to SGF29 (A), MBIP (B), and TAF6L (C). Normalized NSAF results are represented as heatmaps with indicated scales. Dotted boxes indicate the bait protein for a given IP. The known modules of the SAGA complex, such as the HAT module, DUB module, core module, structural module, SM, and AM are indicated. ATAC HAT and core modules are indicated. In (A), the shared HAT subunits are highlighted and the specific HAT subunits indicated. Dotted lines separate functional modules of ATAC and SAGA complexes.
(D) Live-cell measurement of subcellular distribution in GFP-TAF5L (SAGA subunit) and GFP-ZZZ3 (ATAC subunit) HeLa FRT cells. Cells were induced to express the respective GFP-fusion protein for 8 h before imaging (N = 3). Two representative GFP Z maximum intensity projections are shown for each cell line with overlayed nuclear outlines in green. The mean GFP cytoplasmic/nuclear intensity ratio for each cell (shown as a dot) is plotted on the right.

