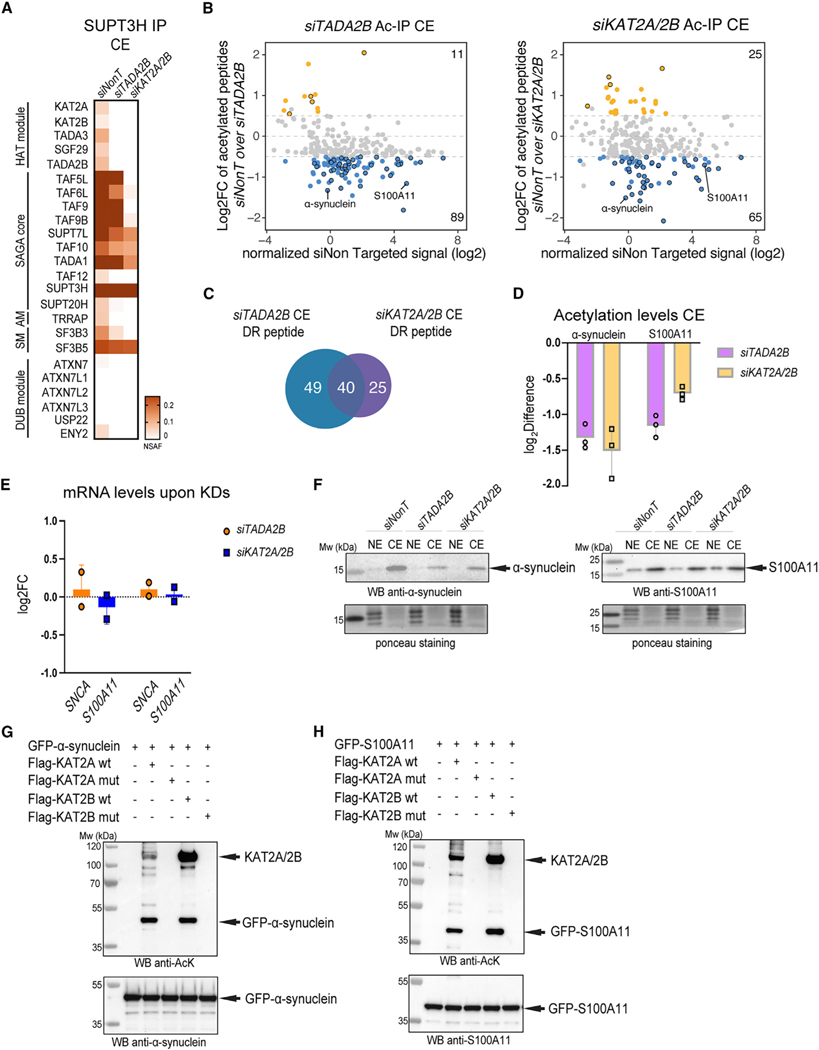
Figure 6. The SAGA complex acetylates non-histone proteins in the cytoplasm.
(A) HeLa cells were transfected with of siNon-targeting (siNonT), siTADA2B, and siKAT2A/2B siRNAs for 48 h, CEs were prepared, and anti-SUPT3H IP-coupled mass spectrometry analysis was carried out. NSAF values were calculated (n = 3; see Table S5 for proteins found in each IP). NSAF values were normalized to the bait SUPT3H, and the results are represented as heatmaps with the indicated scales. The different modules of the SAGA complex are indicated.
(B) Acetylated-lysine IPs were carried out from siNonT-, siTADA2B-, or siKAT2A/2B-treated CEs and analyzed by mass spectrometry (n = 3; see also Table S6 for acetylated proteins found in each IP carried out from CE extracts and their corresponding acetylated lysine residues). Left, MA plot represents log2fold change (FC) of siTADA2B over siNonT (y axis) versus siNonT normalized signal intensity in log2 (x axis). Right, MA plot represents log2FC of siKAT2A/2B over siNonT (y axis) versus siNonT normalized signal intensity in log2 (x axis). Peptides that have upregulated acetylation levels are indicated with orange dots. Peptides that have downregulated acetylation levels are indicated with blue dots. Peptides that have upregulated or downregulated acetylation levels in both KD (TADA2B and KAT2A/KAT2B) conditions are indicated with black circles in each category.
(C) Venn diagram shows number of peptides that had significantly downregulated (DR) acetylation levels under either siTADA2B (blue) or siKAT2A/2B (purple) KD conditions.
(D) Log2 difference of acetylation levels of α-synuclein or S100A11 in both KD condition. Error bars ± SD (n = 3).
(E and F) In vitro acetylation (AT) assay. KAT2A WT, KAT2B WT, and their corresponding catalytic dead mutants (muts) were purified from baculovirus-infected Sf9 cells and GFP-α-synuclein and GFP-S100A11 from transfected HeLa cells. (E) qRT-PCR analysis of mRNA levels of SNCA and S100A11 upon siTADA2B- or siKAT2A/2B-mediated KDs. Error bars ± SD (N = 2). Log2FC was calculated with the 2−ΔΔCT method. GAPDH mRNA was used as an internal control. (F) Western blot analyses of α-synuclein or S100A11 protein levels in both NEs and CEs upon control and siTADA2B or siKAT2A/2B KDs. The left membrane was incubated with anti-α-synuclein antibodies and the right membrane with anti-S100A11 antibodies. Arrows indicate the corresponding proteins. Ponceau S staining was used as a loading control.
(G) In vitro AT of GFP-α-synuclein by KAT2A and KAT2B acetyltransferases. The order of protein addition in the reaction mixtures is depicted on the top. The top membrane shows western blot (WB) analysis using an anti-acetylated lysine antibody and the bottom membrane using an anti-α-synuclein antibody.
(H) In vitro AT of GFP-S100A11 by KAT2A and KAT2B acetyltransferases. The order of protein addition in the reaction mixtures is depicted on the top. The top membrane was immunoblotted with anti-acetylated lysine antibody and the bottom membrane with anti-S100A11 antibody.
In (F)–(H), arrows indicate the corresponding proteins, and molecular weight (Mw) markers are indicated in kDa.

