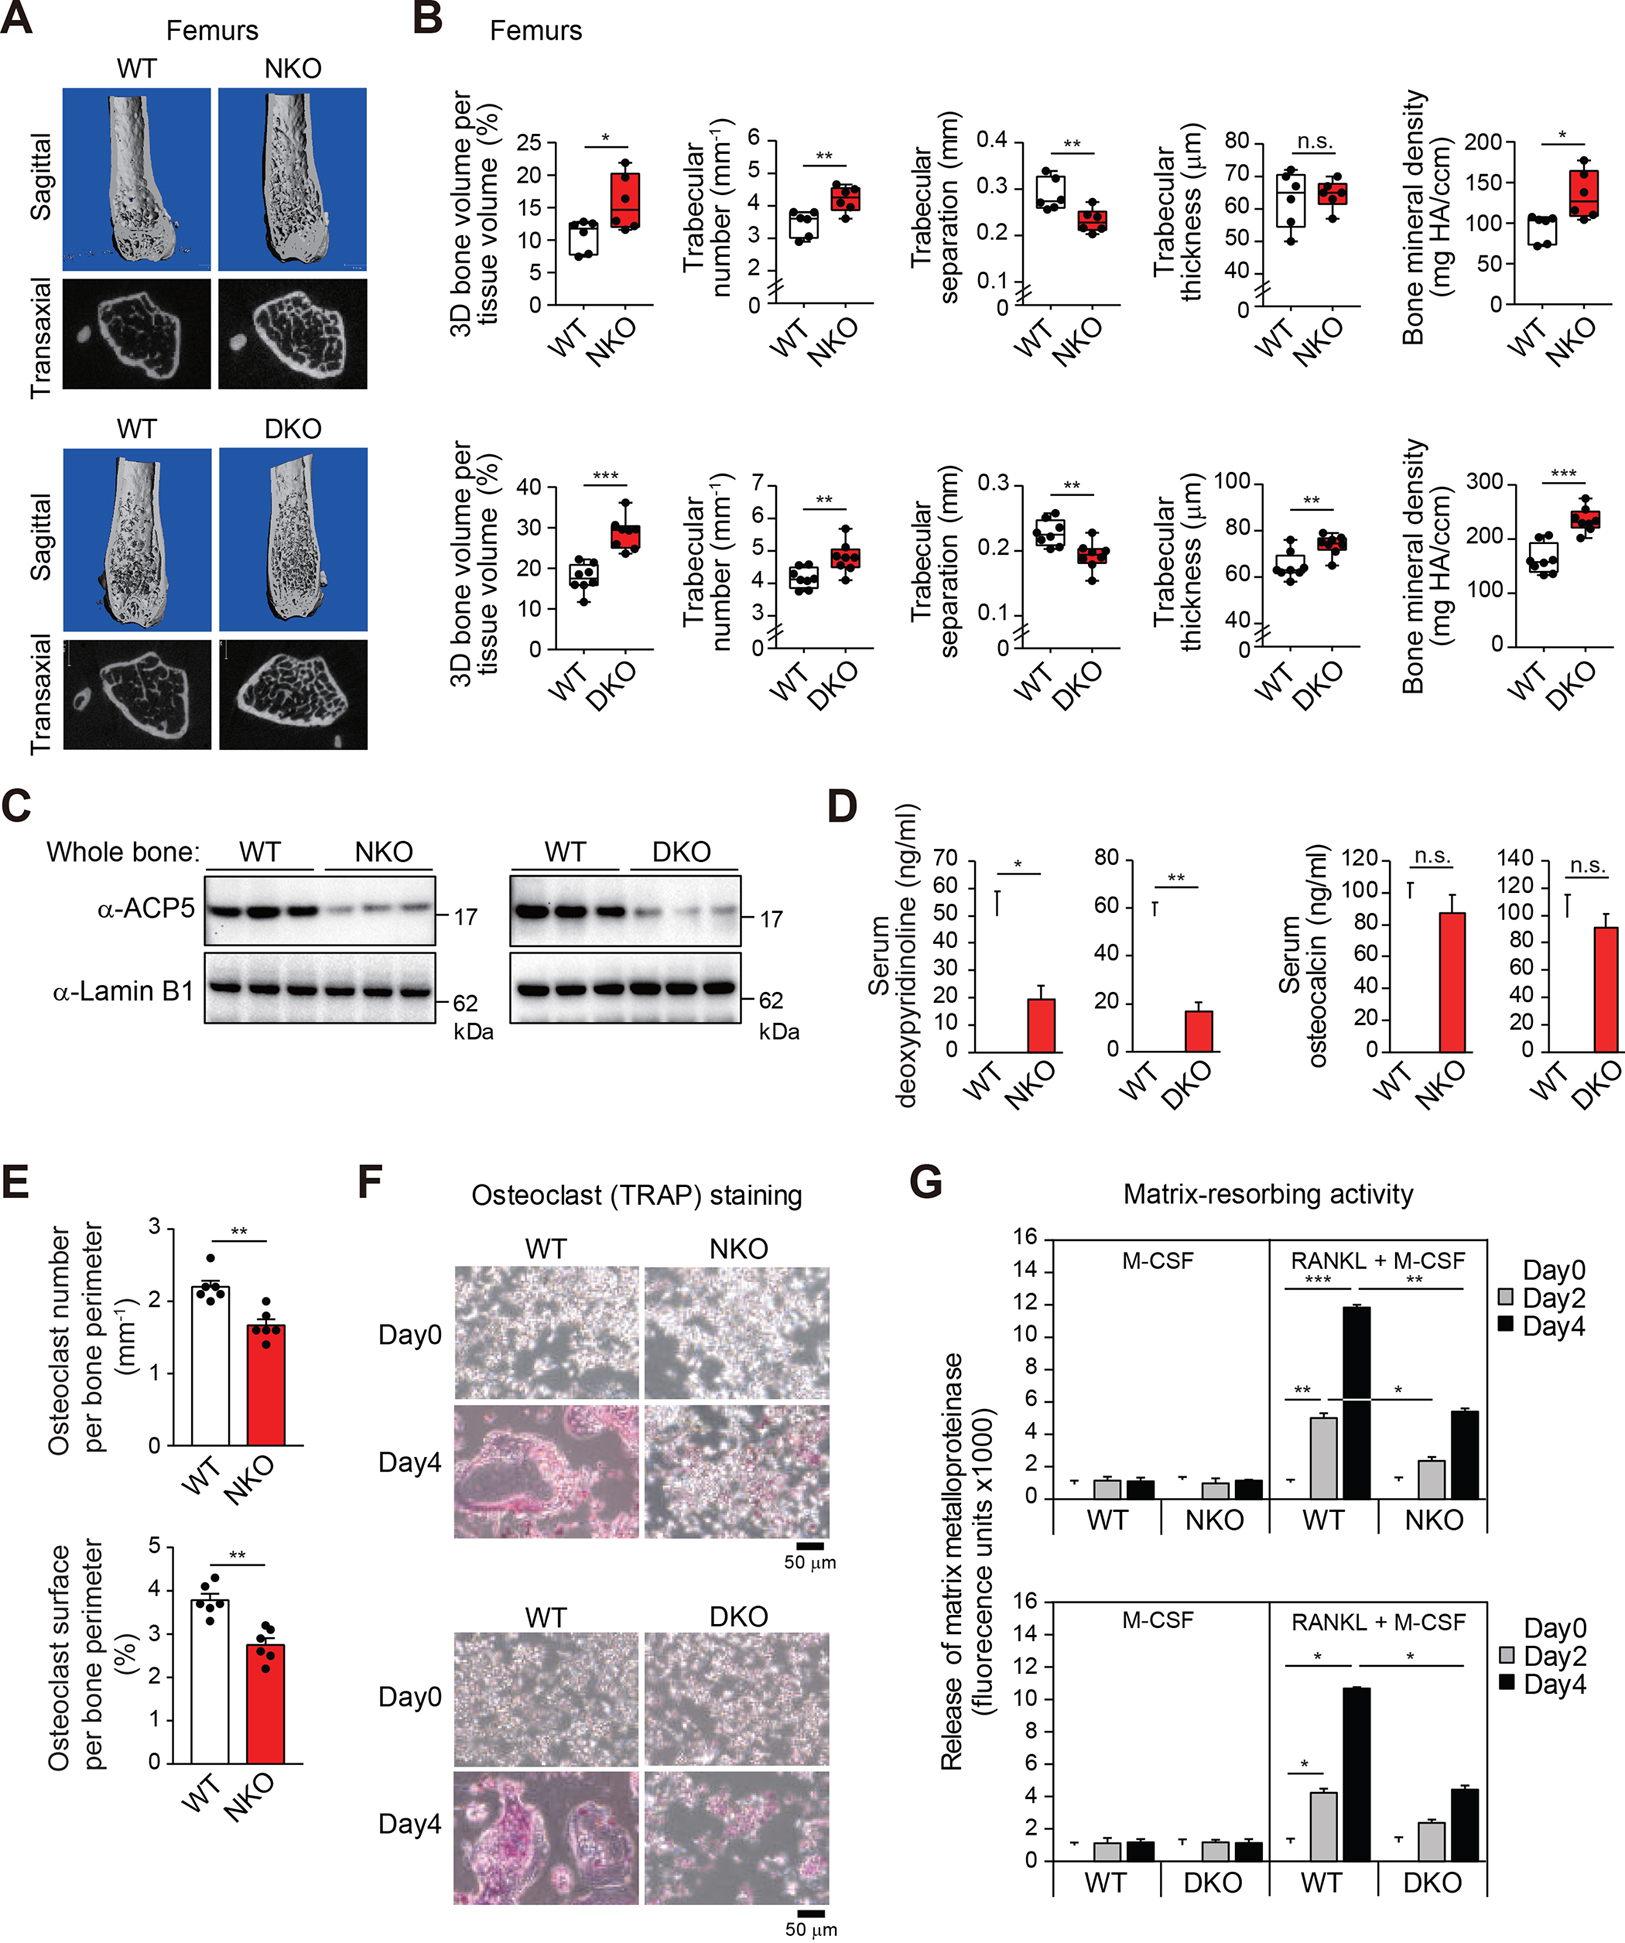
Figure 1. NCoR is required for osteoclast differentiation and normal bone development.

(A, B) Representative microcomputed tomography (μCT) images of the femurs (A) in 5-month-old male WT and NKO or DKO mice. Trabecular bone volume, trabecular number, trabecular separation, trabecular thickness and bone mineral density in the femurs (B) determined by μCT analysis. All box plots show the interquartile range. Data are mean ± s.d. (n=6–8 each). Student’s t-test was performed for comparisons.
(C) Immunoblot analysis for ACP5 protein in whole bone (tibia and femur) from 5-month-old male WT and NKO or DKO mice (n=3 each).
(D) Serum deoxypyridinoline and osteocalcin concentrations in 5-month-old male WT and NKO or DKO mice. Data are mean ± s.e.m. (n=4 biological replicates). Student’s t-test was performed for comparisons.
(E) Quantitative analysis of osteoclast number (upper panel) and surface area (lower panel) in the femurs from 5-month-old male WT and NKO mice. Data are mean ± s.e.m. (n=6 each). Student’s t-test was performed for comparisons.
(F) Representative TRAP-stained cell images showing the effect of NKO or DKO on bone marrow-derived osteoclast formation at Day0 and Day4 after RANKL treatment (12-week-old male mice).
(G) Matrix-resorbing activity on bone marrow derived-osteoclasts from WT and NKO or DKO mice (12-week-old male) in the presence of only M-CSF or M-CSF plus RANKL. Data are mean ± s.d. (n=3 biological replicates). Analysis of variance was performed followed by Tukey’s post hoc comparison.
For panels B, D, E and G; *p < 0.05, **p < 0.01 and ***p < 0.001.
See also Figure S1.
