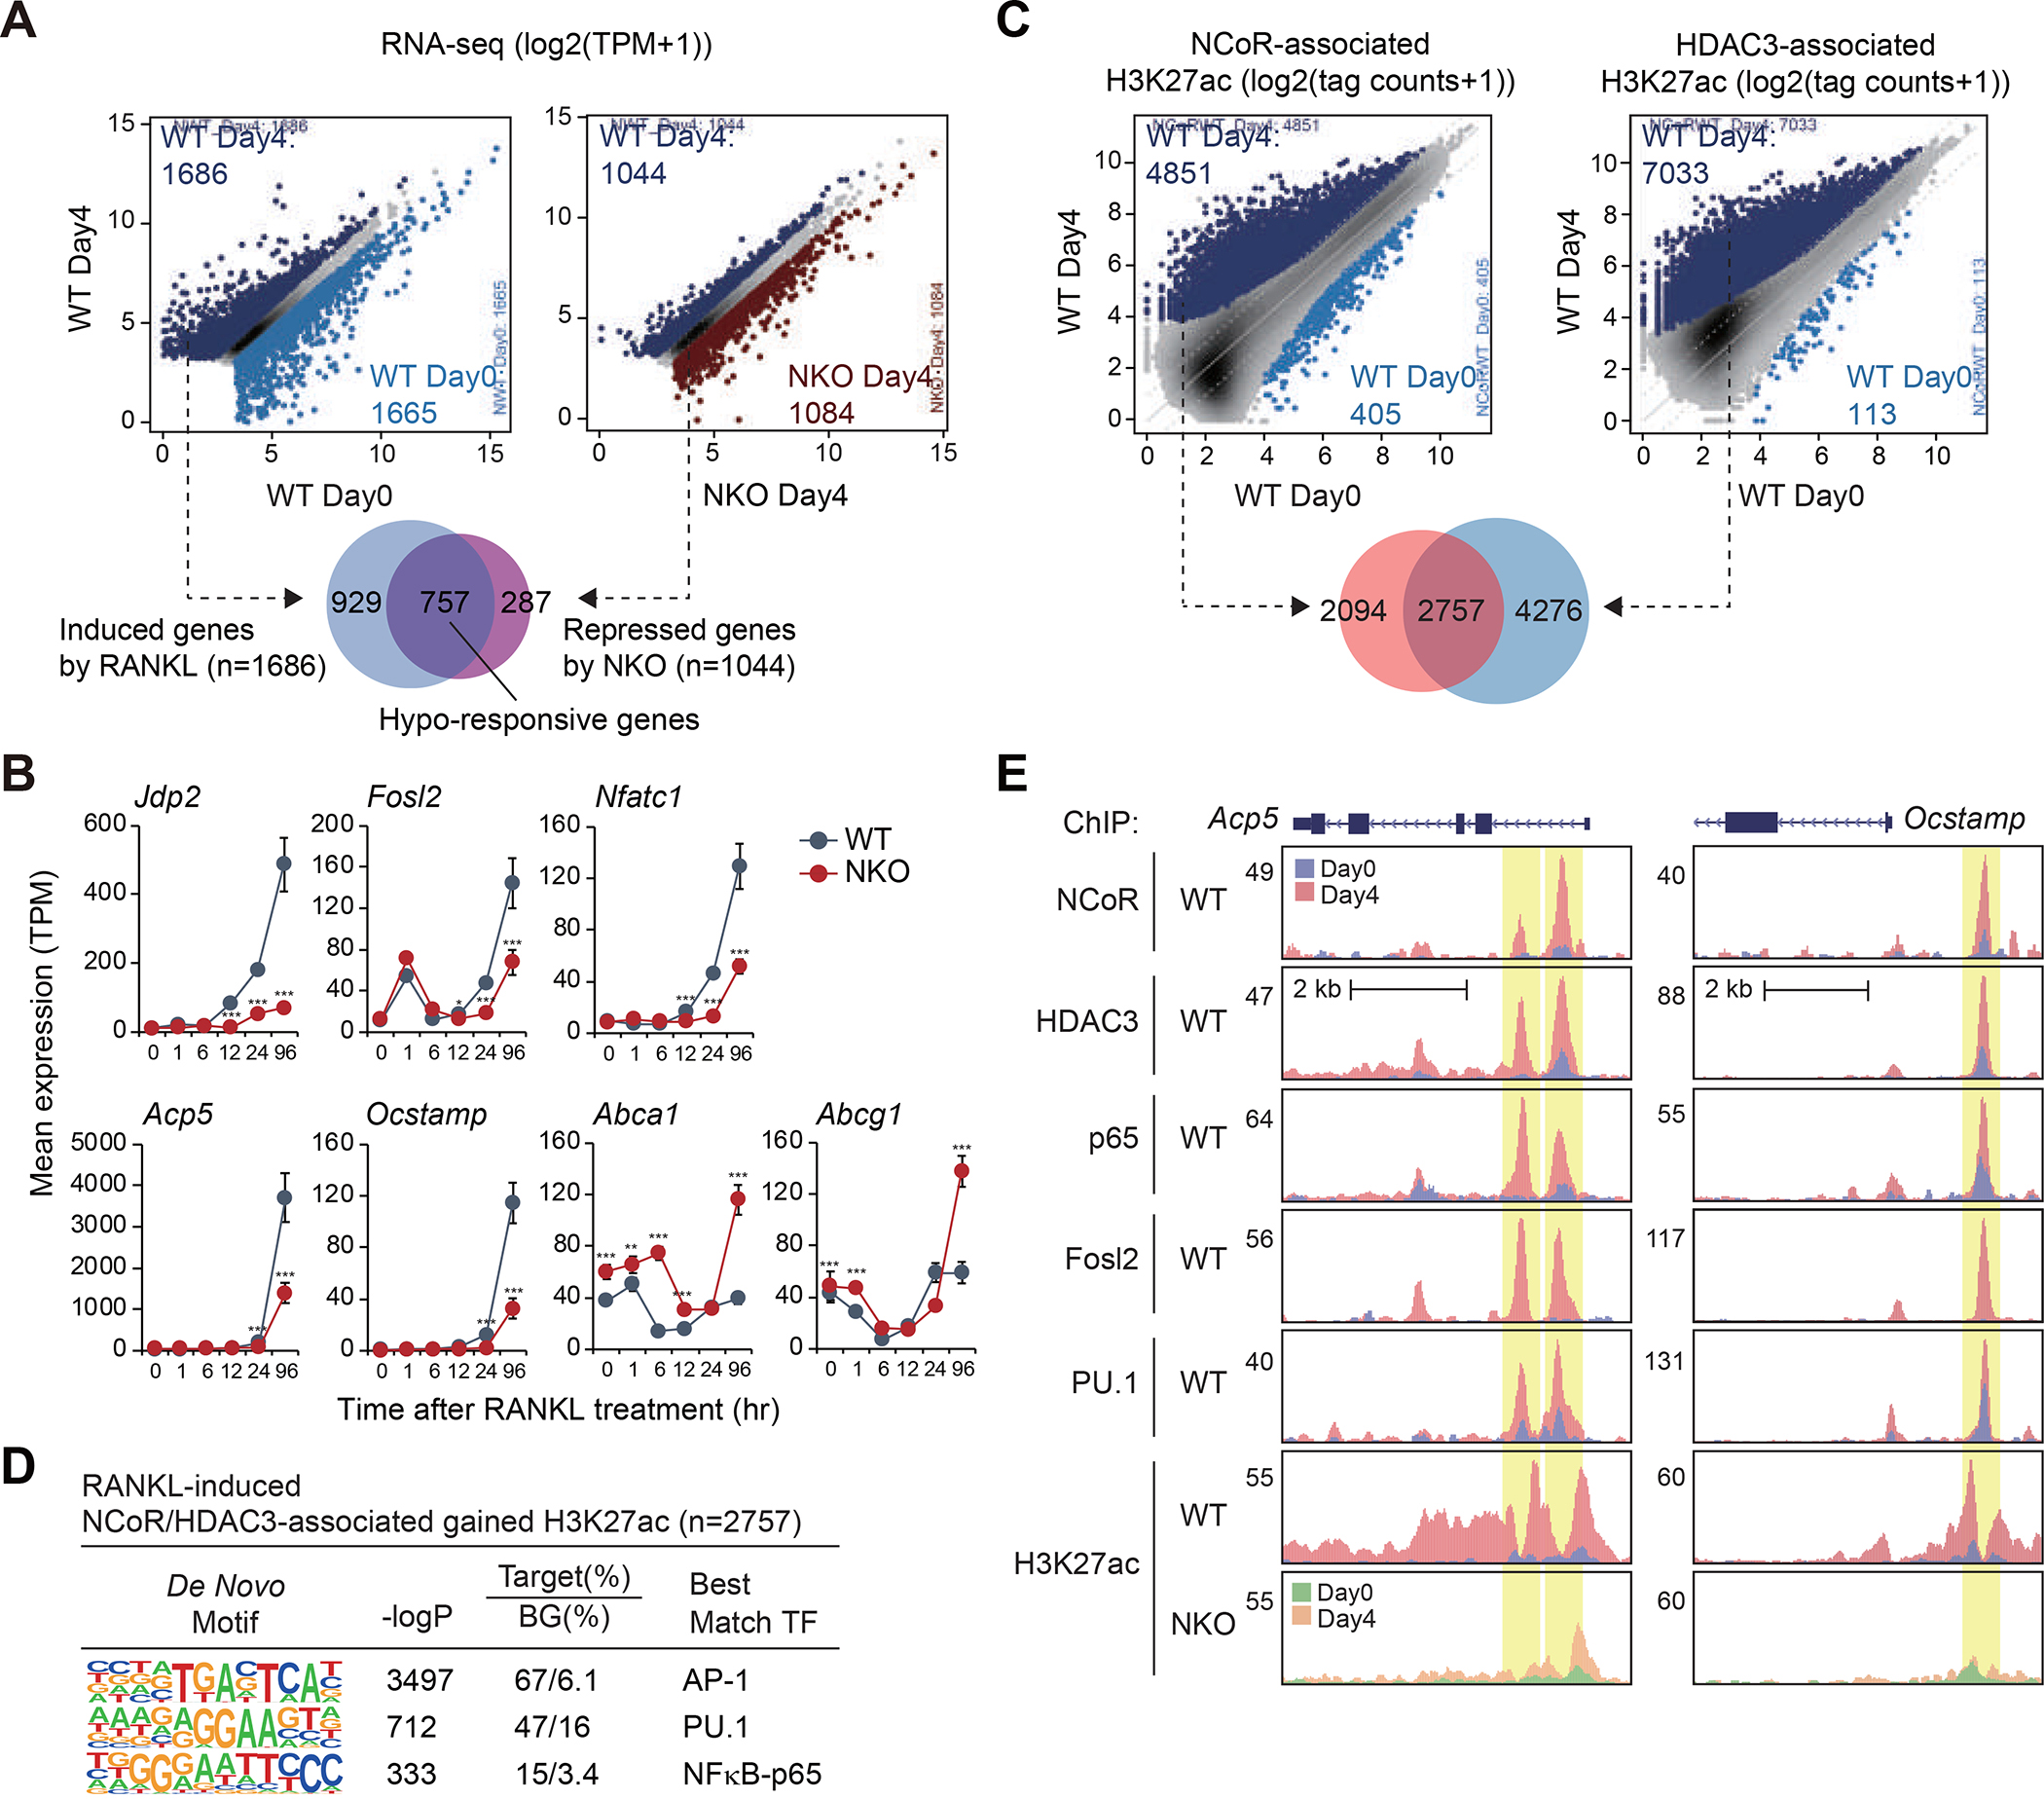
Figure 2. NCoR/HDAC3 complexes bind to RANKL-induced enhancers and promoters.

(A) Scatter plots of RNA-seq data showing RANKL-regulated gene expression in WT cells (left panel) and NKO-regulated gene expression in the presence of RANKL (right panel) (light blue dots in left panel: significantly RANKL-suppressed genes, dark blue dots in left panel: significantly RANKL-induced genes, dark red dots in right panel: significant NKO-induced genes, dark blue dots in right panel: significant NKO-suppressed genes, FDR < 0.05, FC > 1.5). The overlap between RANKL-induced genes in WT cells (n=1686) and NKO-suppressed genes in the presence of RANKL (n=1044) is shown by Venn diagram.
(B) Expression of Jdp2, Fosl2, Nfatc1, Acp5, Ocstamp, Abca1 and Abcg1 in WT and NKO cells as a function of time following RANKL treatment. The significance symbols indicate statistical significance comparing NKO to WT, *p-adj < 0.05, **p-adj < 0.01 and ***p-adj < 0.001.
(C) Scatter plot of distal NCoR (41058 peaks in Figure S2C)- (left panel) or HDAC3 (31832 peaks in Figure S2D)- (right panel) associated H3K27ac in WT at Day0 vs. WT at Day4. RANKL-induced NCoR- or HDAC3-associated H3K27ac peaks (FDR < 0.05, FC > 2) are color-coded (light blue dots: significantly NCoR- or HDAC3-associated lost H3K27ac in WT at Day4, dark blue dots: significantly NCoR- or HDAC3-associated gained H3K27ac in WT at Day4). The overlap between NCoR-associated gained H3K27ac (n=4851) and HDAC3-associated gained H3K27ac (n=7033) is shown by Venn diagram.
(D) De novo motif enrichment analysis of RANKL-induced NCoR and HDAC3-associated gained H3K27ac peaks (n=2757 in Figure 2C) using a GC-matched genomic background.
(E) Genome browser tracks of NCoR, HDAC3, p65, Fosl2, PU.1 and H3K27ac ChIP-seq peaks in the vicinity of the Acp5 and Ocstamp loci at Day0 and Day4 after RANKL treatment. Yellow shading: RANKL-induced peaks.
See also Figure S2.
