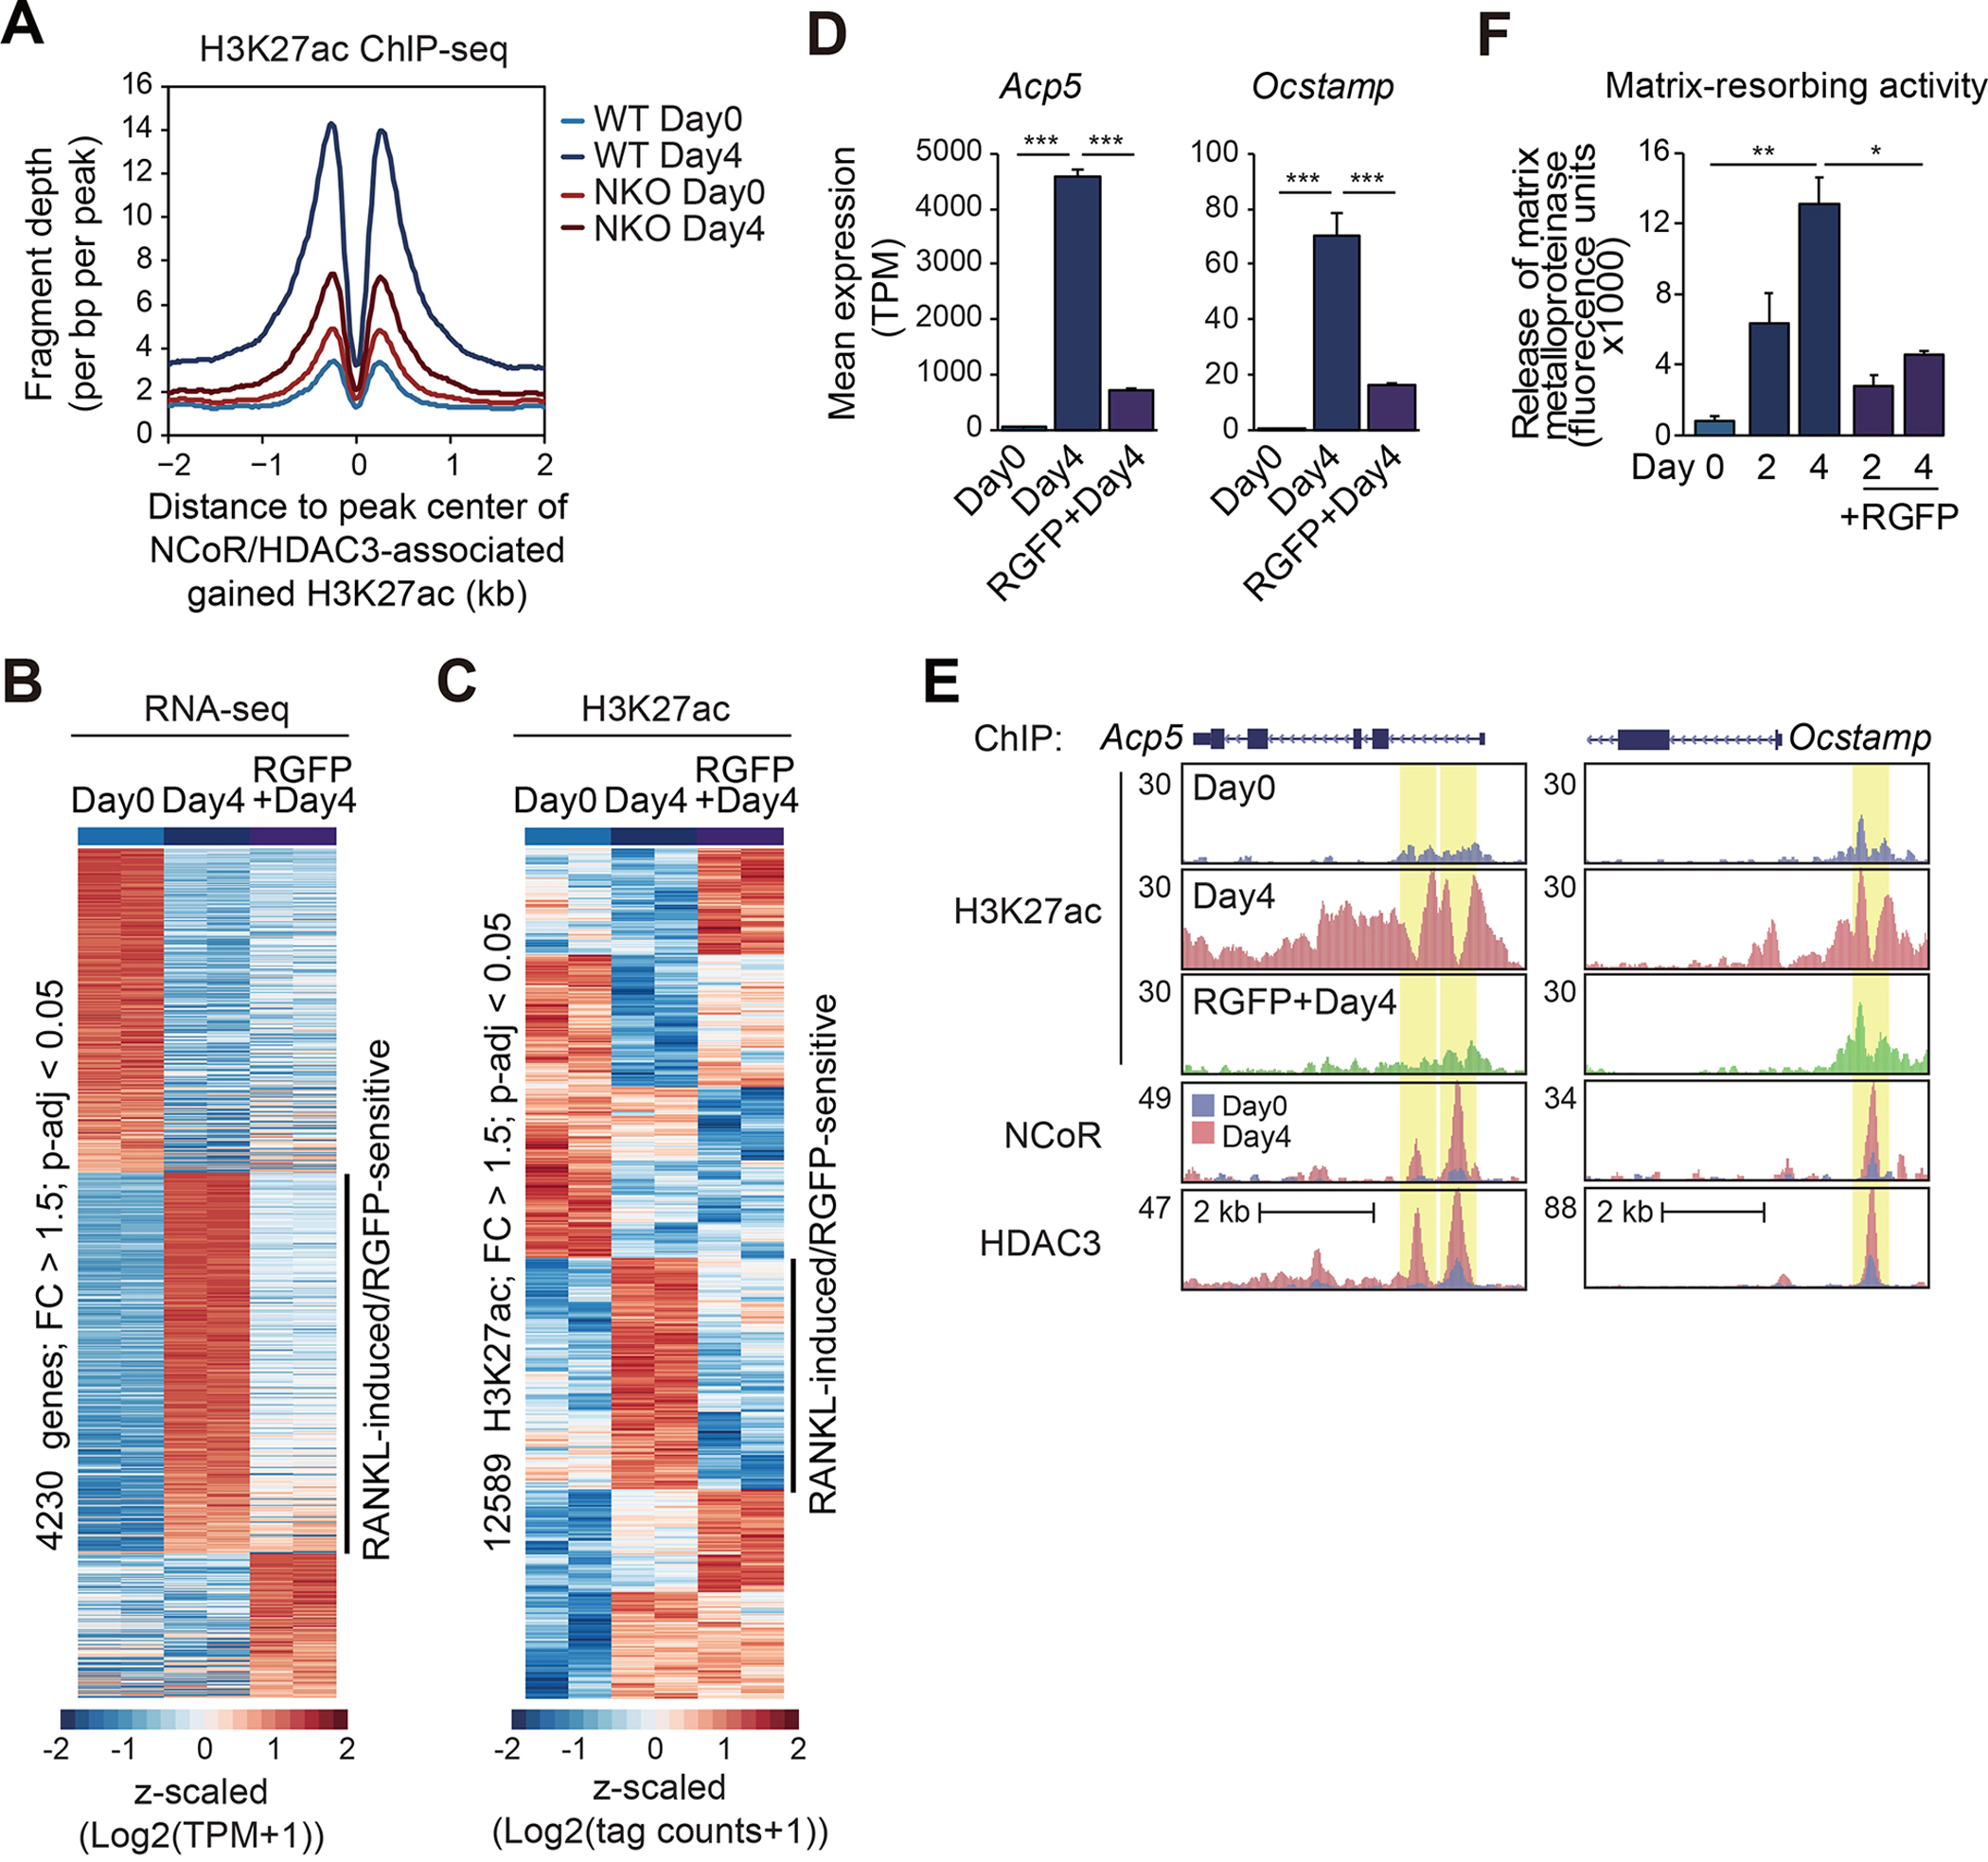
Figure 3. NCoR and HDAC3 activity are required for RANKL-induced H3K27 acetylation.

(A) Normalized distribution of H3K27ac tag density in WT and NKO at the vicinity of NCoR and HDAC3-associated gained H3K27ac peaks in WT at Day4 after RANKL treatment (n=2757 in Figure 2C).
(B) Heatmap of differential gene expression (FC > 1.5, p-adj < 0.05) in WT cells treated with the combination of RGFP966 with RANKL.
(C) Heatmap of differential H3K27ac ChIP-seq IDR peaks associated with ATAC-seq IDR peaks (FC > 1.5, p-adj < 0.05) at Day0 in a 1000 bp window.
(D) Bar plots for expression of Acp5 and Ocstamp. ***p-adj < 0.001.
(E) Genome browser tracks of H3K27ac ChIP-seq peaks in WT at Day0 and Day4 with or without RGFP966, and NCoR and HDAC3 ChIP-seq peaks in WT at Day0 and Day4 in the vicinity of the Acp5 and Ocstamp loci. Yellow shading: RANKL-induced RGFP966-sensitive peaks.
(F) RANKL-induced matrix-resorbing activity on bone marrow cells from WT mice (12-week-old male) in the presence or absence of RGFP966. Data are mean ± s.e.m. (n=3 biological replicates). Analysis of variance was performed followed by Tukey’s post hoc comparison. *p < 0.05 and **p < 0.01.
See also Figure S3.
