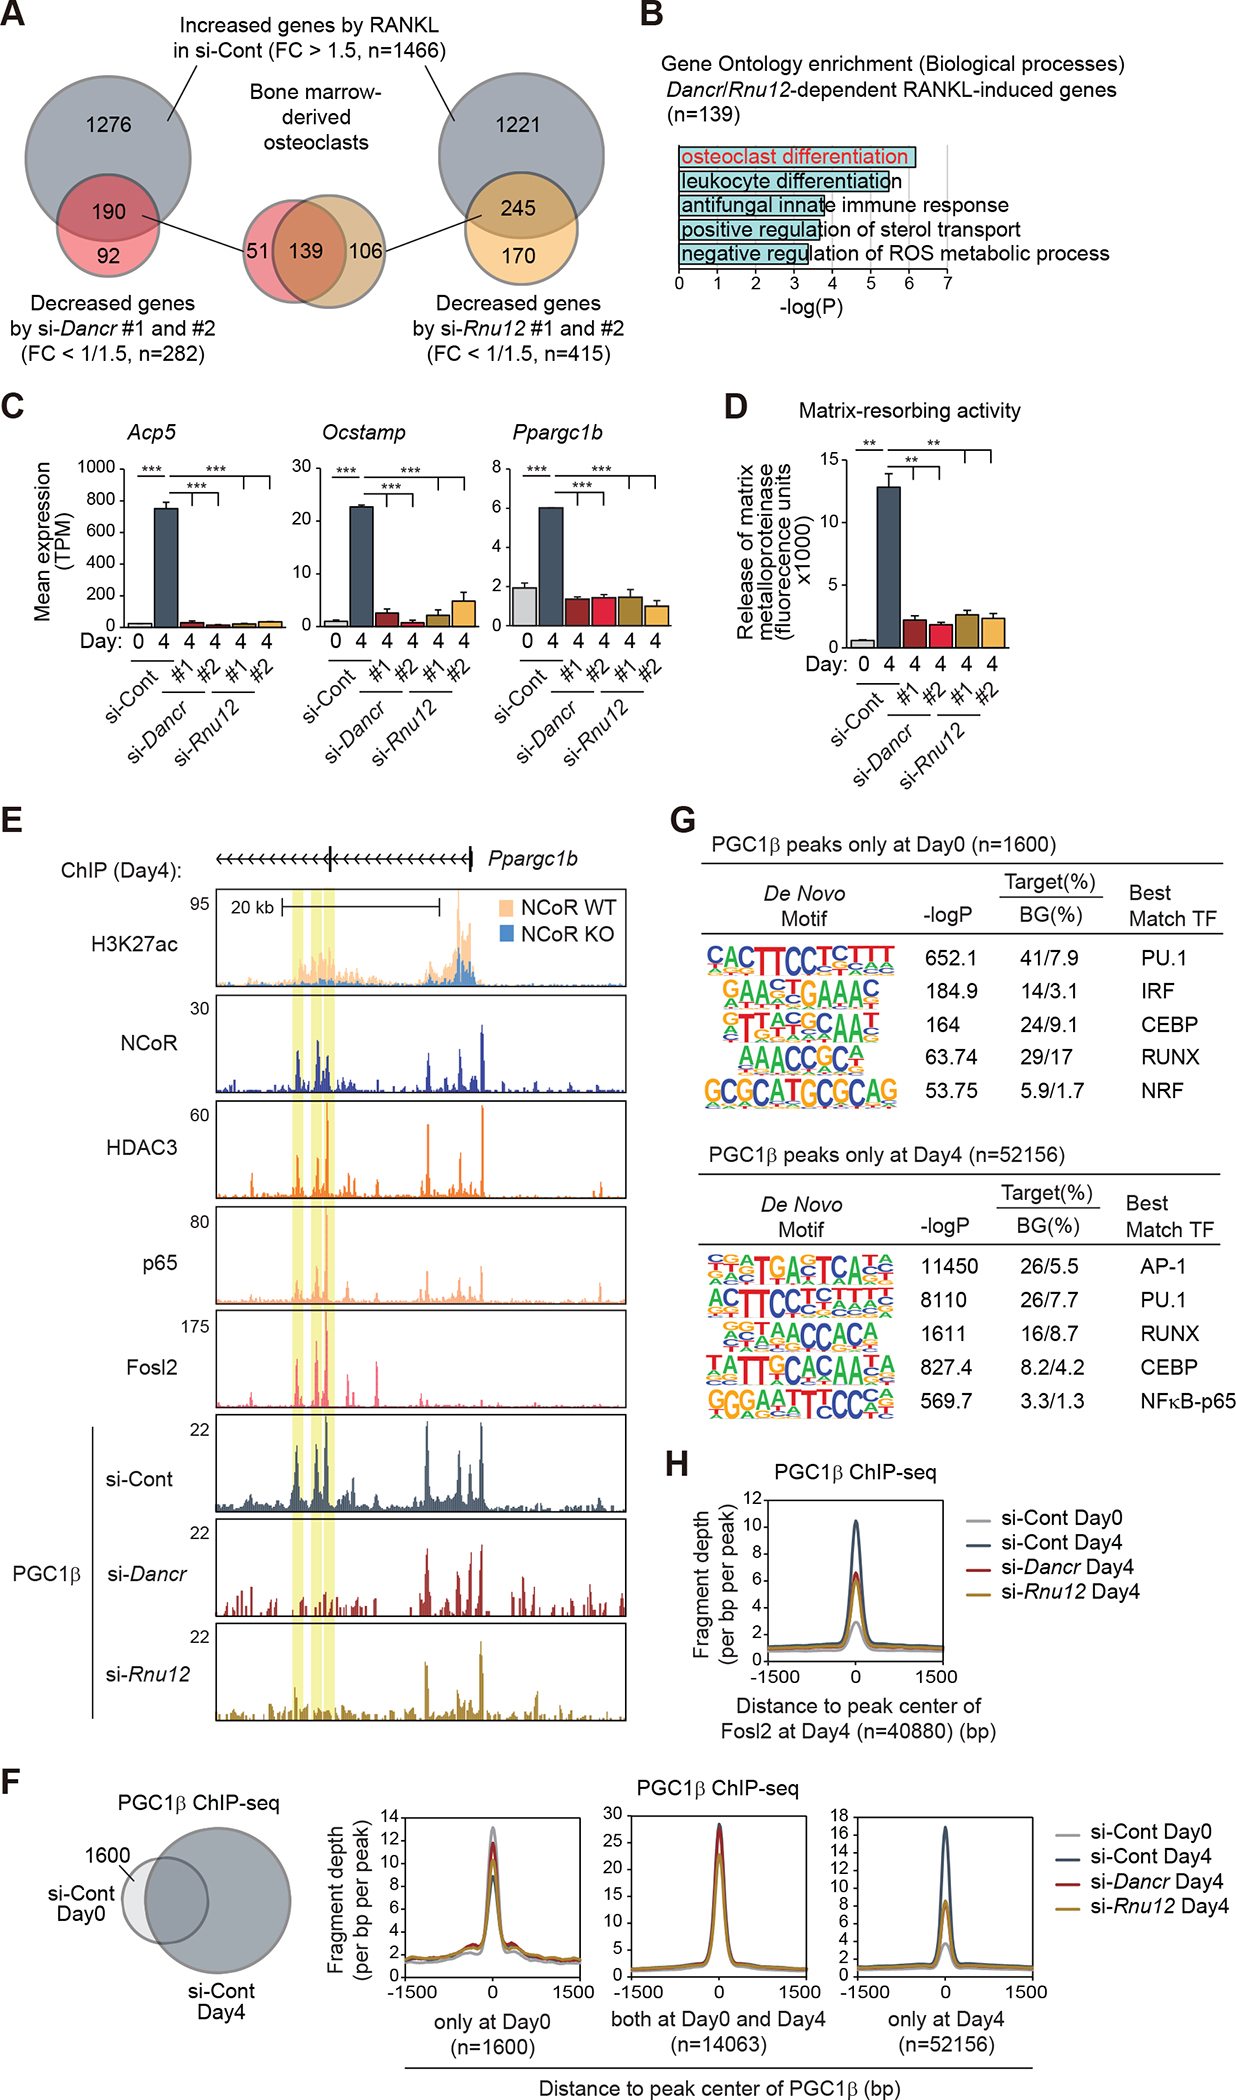
Figure 7. Dancr and Rnu12 are required for RANKL-induced osteoclast differentiation.

(A) The overlaps between RANKL-induced genes in si-Cont (FC > 1.5, FDR < 0.05) and suppressed genes by si-Dancr (left, #1 and #2) or si-Rnu12 (right, #1 and #2) (FC < 1/1.5, FDR < 0.05) in bone marrow-derived osteoclasts are shown by Venn diagram.
(B) Significant gene ontology terms associated with Dancr/Rnu12-dependent RANKL-induced genes (n=139 in Figure 7A).
(C) Bar plots for expression of Acp5, Ocstamp and Ppargc1b in siRNA (si-Cont, si-Dancr or si-Rnu12)-introduced bone marrow cells at Day0 and Day4 after RANKL treatment. ***p-adj < 0.001.
(D) Matrix-resorbing activity on siRNA (si-Cont, si-Dancr or si-Rnu12)-introduced bone marrow cells at Day0 and Day4 after RANKL treatment. Data are mean ± s.e.m. (n=3 biological replicates). Analysis of variance was performed followed by Tukey’s post hoc comparison. **p < 0.01.
(E) Genome browser tracks of H3K27ac, NCoR, HDAC3, p65, Fosl2 and PGC1β ChIP-seq peaks in bone marrow cells at Day4 after RANKL treatment in the vicinity of Ppargc1b locus. Yellow shading: lost PGC1β peak by knockdown of Dancr/Rnu12.
(F) The overlap between IDR-defined PGC1β ChIP-seq peaks in control siRNA-introduced bone marrow cells at Day0 and Day4 after RANKL treatment is shown by Venn diagram. Normalized distribution of PGC1β ChIP-seq tag density in siRNA (si-Cont, si-Dancr or si-Rnu12)-introduced bone marrow cells at the vicinity of PGC1β binding regions at Day0 and/or Day4.
(G) De novo motif enrichment analysis of PGC1β peaks at Day0 (n=1600 in Figure 7F) and at Day4 (n=52156 in Figure 7F) using a GC-matched genomic background.
(H) Normalized distribution of PGC1β ChIP-seq tag density in siRNA (si-Cont, si-Dancr or si-Rnu12)-introduced bone marrow cells at the vicinity of Fosl2 binding regions at Day4.
See also Figure S6.
