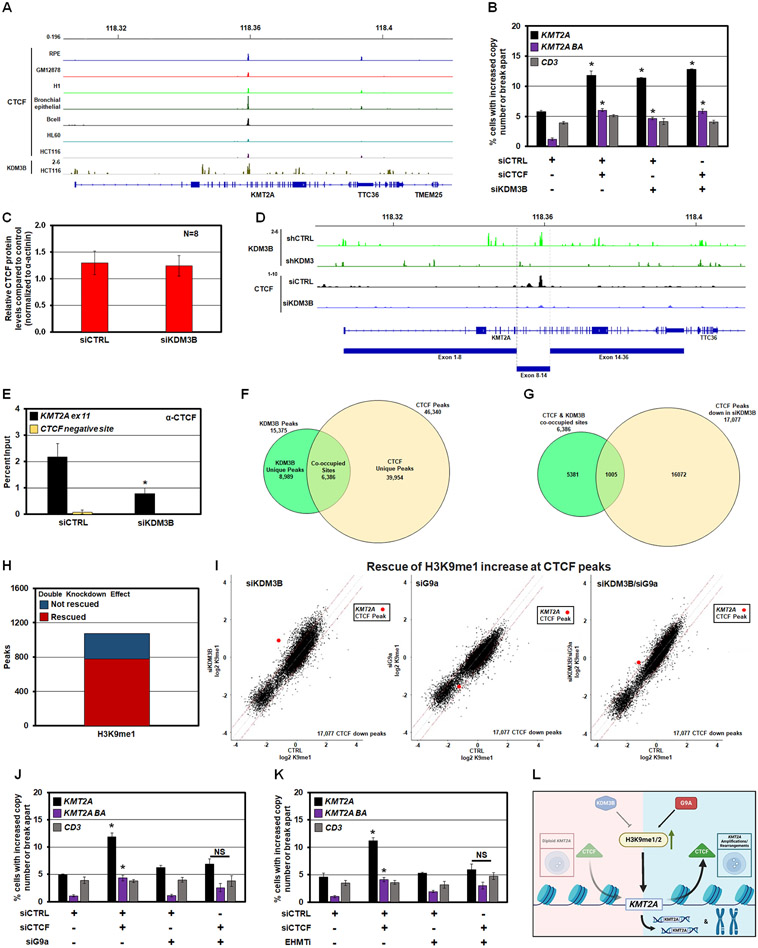
Figure 5. Reduced CTCF occupancy leads to KMT2A copy gains and break aparts.
(A) Publicly available ENCODE input-normalized ChIP-seq tracks densities of CTCF in multiple ENCODE cell lines or tissues at the KMT2A locus. CTCF binding at exon 11 of KMT2A is conserved in multiple cell lines and directly overlaps with KDM3B binding in HCT116 cells 51.
(B) DNA FISH demonstrating single and co-siRNA depletion of KDM3B and CTCF promotes KMT2A copy gains and break aparts. No significant change occurred with the CD3 probe.
(C) Quantification of western blots for CTCF in KDM3B siRNA depleted RPE cells. No significant change in steady state total CTCF protein levels were observed.
(D) Publicly available input-normalized ChIP-seq tracks of KDM3B 51 in control and shKDM3 cells. KDM3B binds at exon 11 and is lost upon shKDM3 (green tracks). Lower tracks: input-normalized ChIP-seq tracks of CTCF showing that siKDM3B reduced CTCF binding at exon 11 in RPE cells.
(E) ChIP-qPCR demonstrating suppression of CTCF occupancy at KMT2A exon 11 (KMT2A ex 11; black) or a negative control for CTCF binding (CTCF negative site; yellow) following KDM3B siRNA depletion.
(F) Venn diagram of the overlap between KDM3B ChIP-seq peaks from a public dataset and CTCF ChIP-seq peaks in this study. 6,386 of all KDM3B binding sites (41.5%) co-localize with a CTCF binding site (P-value=1.0e-07).
(G) A total of 17,077 CTCF sites out of 46,340 (36.9%) had reduced occupancy with KDM3B depletion. Among all 6,386 KDM3B binding sites coinciding with CTCF binding, 1,005 sites show a significant decrease in CTCF binding upon KDM3B knockdown. Z-score=143.38 corresponding to a P-value close to 0.
(H) Double KDM3B and G9a knockdown rescued the increase of H3K9me1 at the majority of CTCF peaks reduced by siKDM3B. Barplot showing genome-wide number of CTCF proximal regions (+/− 5Kb from a CTCF peak) that decreased CTCF and increased H3K9me1 level upon KDM3B knockdown (points above upper red line in I, left scatterplot). Red, the fraction of regions where this increase was rescued by double knockdown (points moved below upper red line in I, right scatterplot).
(I) Genome-wide effects of siKDM3B, siG9a, and double knockdown on H3K9me1 levels at the subset of CTCF binding sites where CTCF binding was decreased by siKDM3B (17,077 sites). KDM3B and G9a knockdowns have opposite skews, whereas the double knockdown strongly reduces these H3K9me1 changes. Left, scatterplot comparing input-normalized H3K9me1 ChIP-seq densities in +/− 5Kb proximity of all these individual CTCF peaks across the genome in control vs siKDM3B; H3K9me1 changes are skewed towards increase (points above upper red line corresponding to > 1.5 fold increase in siKM3B cells). Middle, scatterplot for control vs siG9a cells; H3K9me1 changes are skewed towards decrease (points below lower red line corresponding to > 1.5 fold decrease in siG9a cells). Right, scatterplot for control vs siKDM3B + siG9a cells, with much fewer H3K9me1 changes in either direction. Red point, +/−5-Kb vicinity of CTCF binding site within KMT2A gene.
(J) DNA FISH demonstrating siRNA depletion of G9a prevents KMT2A copy gains and break aparts upon CTCF siRNA depletion. No significant change occurred with the CD3 probe.
(K) DNA FISH demonstrating EHMT1/2 chemical inhibition prevents KMT2A copy gains and break aparts upon CTCF siRNA depletion. No significant change occurred with the CD3 probe.
(L) A model depicting interplay between KDM3B-G9a-CTCF upon H3K9me1/2 modulation.
Error bars represent the SEM. *p < 0.05 by two-tailed Student’s t-test.

