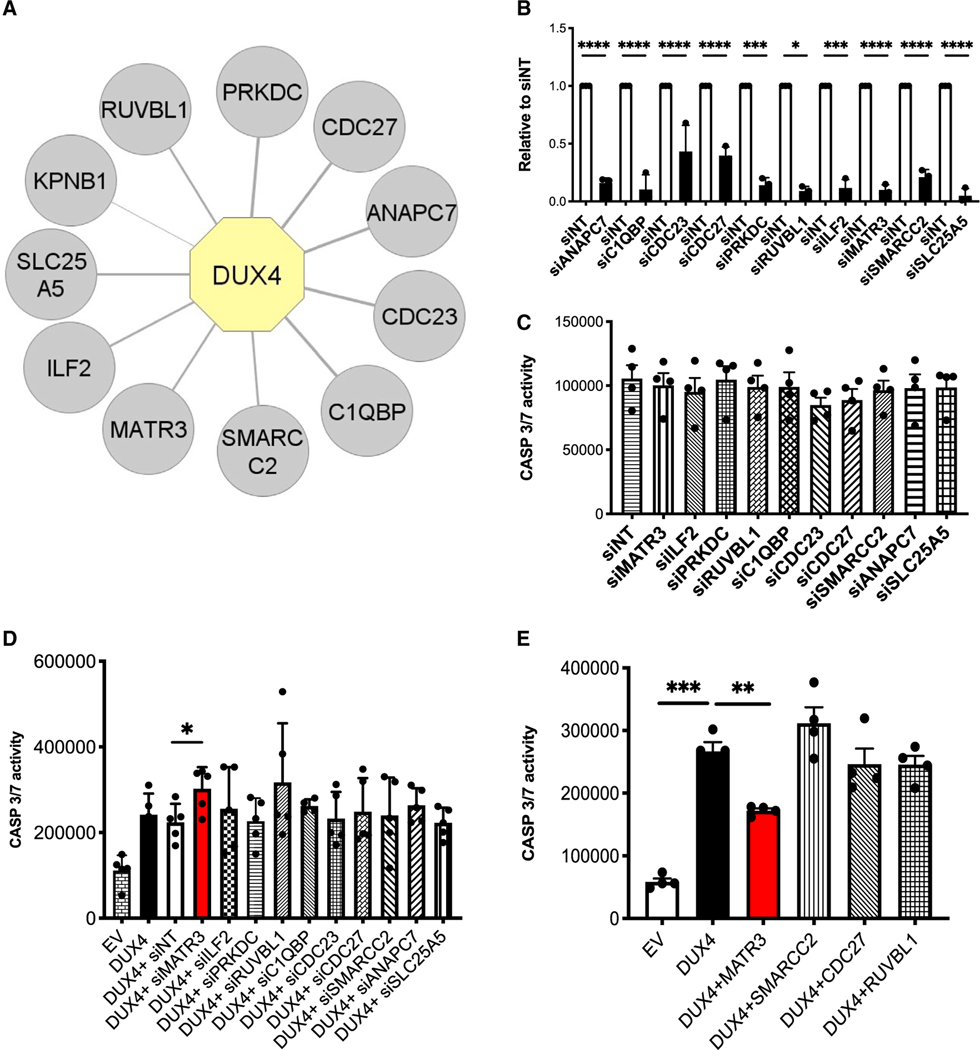
Figure 1. MATR3 protects HEK293 cells from DUX4-induced apoptosis.
(A) Graphical representation of DUX4 nuclear interactors identified by proteomics. Proteins identified in all the STREP-HA affinity purifications with a spectral count average of DUX4/EV control ratio >4 are displayed. DUX4 is highlighted in yellow, and the interactors are displayed in gray. The thickness of the edges is proportional to the spectral count average of DUX4/EV ratio.
(B) Quantitative real-time quantitative PCR showing the efficiency of knockdown for the indicated DUX4 interactors in HEK293 cells. Values are expressed relative to cells transfected with control small interfering RNAs (siRNAs; siNTs) (unpaired Student’s t test, *p ≤ 0.05; ***p ≤ 0.001; ****p ≤ 0.0001, n = 3).
(C) Caspase-3/7 activity assays performed upon knockdown of the indicated DUX4 interactors in HEK293 cells not expressing DUX4 (paired Student’s t test, n = 4).
(D) Caspase-3/7 activity assays performed in HEK293 cells collected 48 h after transfection with empty vector (EV), DUX4, or DUX4 in combination with siRNAs specific for the indicated targets (paired Student’s t test, *p < 0.05, n = 5).
(E) Caspase-3/7 activity assays performed in HEK293 cells collected 48 h after transfection with EV, DUX4, or DUX4 in combination with expression vectors for the indicated factors (paired Student’s t test, **p < 0.01, ***p < 0.001, n = 4).
See also Figures S1 and S2 and Table S1.

