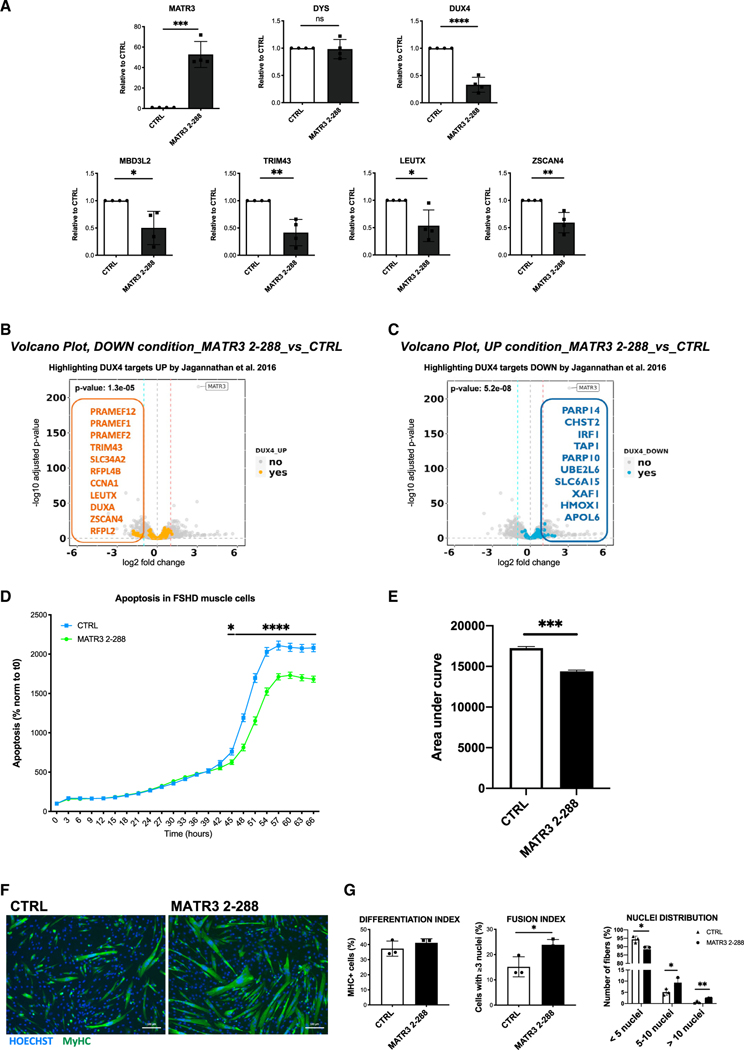
Figure 5. MATR32–288 blocks DUX4-dependent gene expression and rescues viability and muscle differentiation in primary FSHD muscle cells.
(A) Quantitative real-time quantitative PCR for the indicated genes performed on RNA from differentiated primary FSHD muscle cells transduced with a CTRL or with MATR32–288 lentiviruses. Data are represented as relative to CTRL (unpaired Student’s t test, *p < 0.05, **p < 0.01, ***p < 0.001, ****p < 0.0001, n = 3).
(B) Volcano plot showing the significantly downregulated genes by MATR32–288 overexpression among the lists of DUX4 upregulated targets from Jagannathan et al.,34 filtered for absolute values of |log2 fold change (FC)| >1.
(C) Volcano plot showing the significantly upregulated genes by MATR32–288 overexpression among the lists of DUX4 downregulated targets from Jagannathan et al.,34 filtered for absolute values of |log2 FC| >1.
(D) Live-cell, real-time, caspase-3/7 apoptotic assays on primary FSHD muscle cells transduced with CTRL or MATR32–288 lentiviruses. Live-cell imaging was performed by IncuCyte S3 Imager system and quantified using the IncuCyte software. Data are reported as a percentage (%) of green-fluorescent apoptotic cells normalized to time 0 (two-way ANOVA, *p < 0.05, ****p ≤ 0.0001, n = 3).
(E) Quantification of the area under the curve in (D) (unpaired Student’s t test, ***p ≤ 0.001).
(F) Representative images of MyHC (green) and nuclei (Hoechst 33342, blue) staining performed on differentiated primary FSHD muscle cells transduced with CTRL or MATR32–288 lentiviruses. Scale bar: 100 μm.
(G) Quantification of differentiation index, fusion index, and nuclei distribution in primary FSHD muscle cells treated as in (F) (unpaired Student’s t test, *p < 0.05, **p < 0.01, n = 3).
See also Figures S9 and S10 and Table S5.

