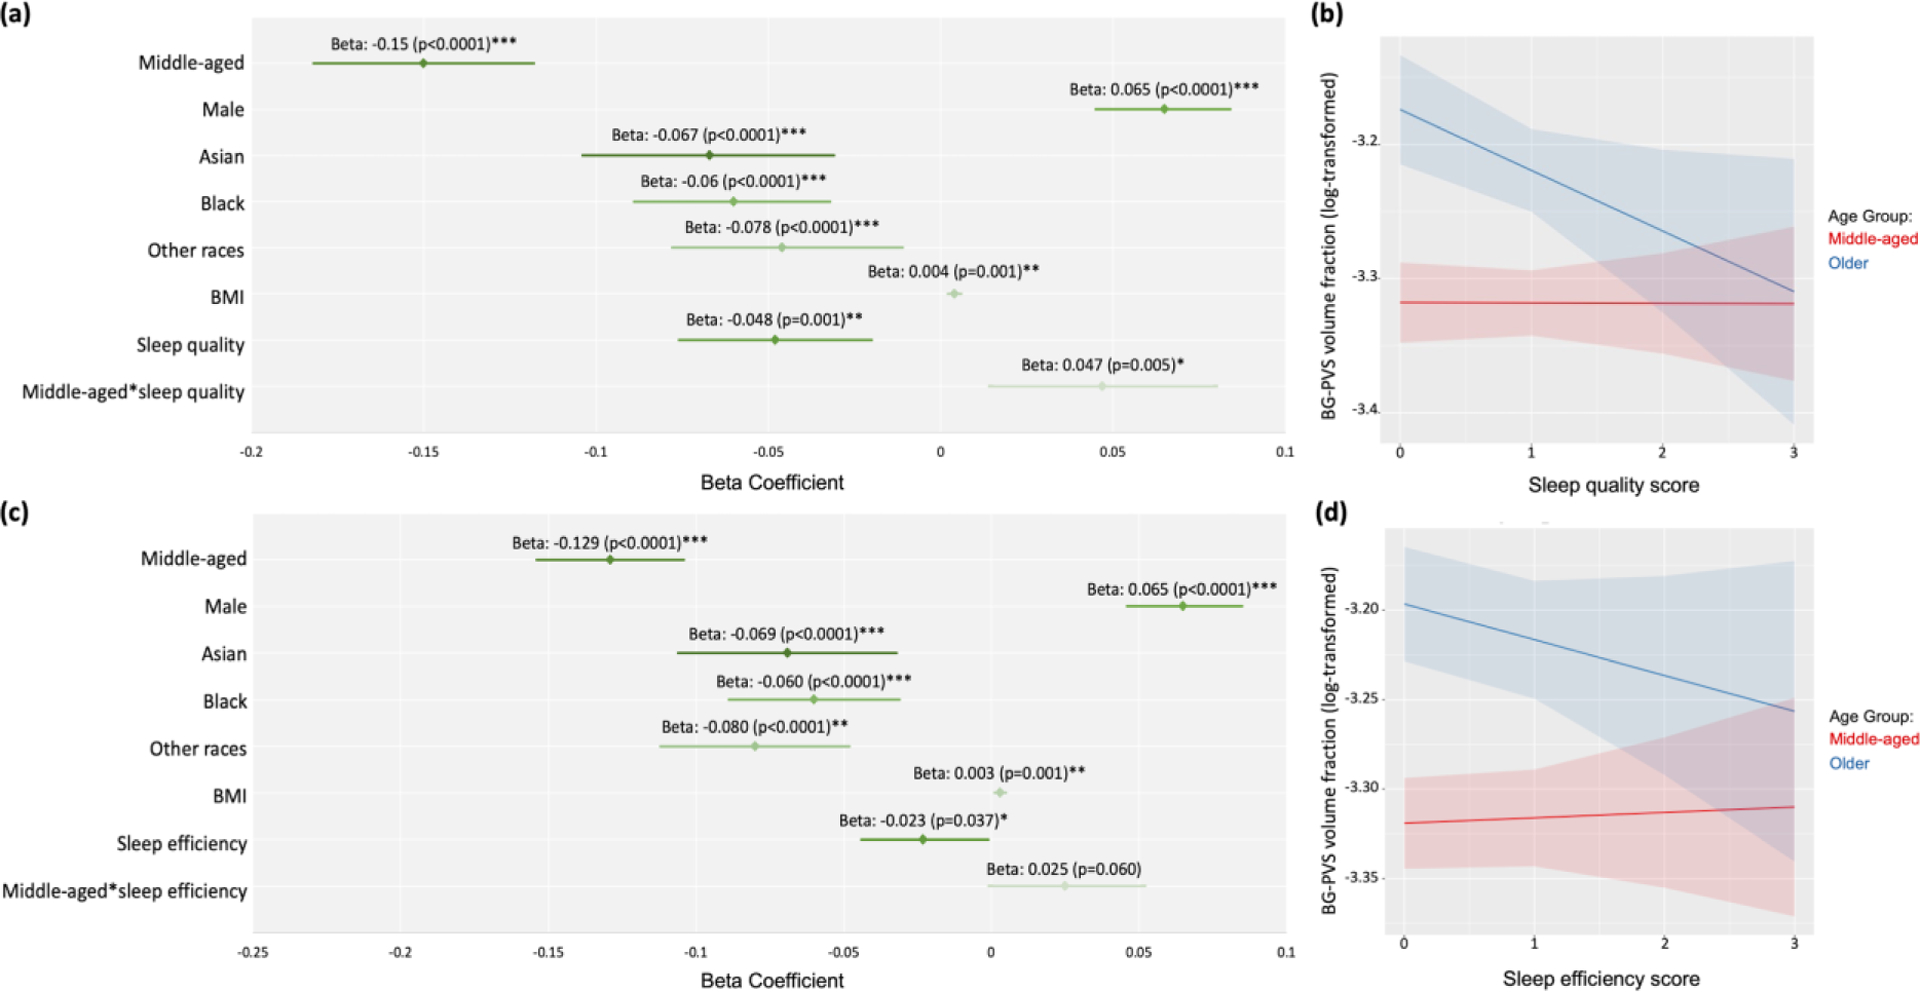
Figure 3. Forest plots illustrating the association between the PVS volume fraction and sleep measures in healthy participants.

(a) Multiple linear regression analysis was conducted to investigate the relationship between the PVS volume fraction in basal ganglia (BG) and sleep quality score. (b) The interaction between age groups and sleep quality. (c) The relationship between the PVS volume fraction in BG and sleep efficiency score. (d) The interaction between age groups and sleep efficiency. The red line represents the middle-aged group (mean of age= 49.50 years old); the blue line represents the older age group (mean of age= 70.19 years old). Significant *p<0.05; **p<0.001; ***p<0.0001
