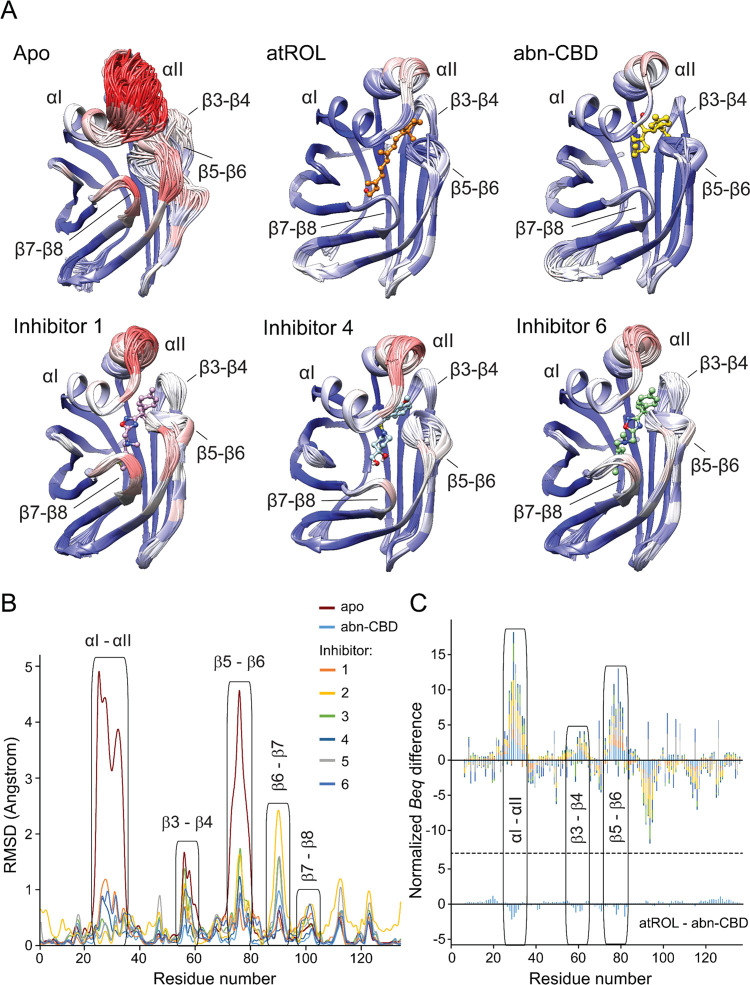
Figure 4.
Changes in the structural dynamics of CRBP1 upon interaction with atROL and nonretinoid inhibitors. (A) Cartoon representation of the ensemble refinement of the crystallographic structures of CRBP1 in the apo and ligand-bound states. The color scheme represents the average B-factors per residue, with the highest values marked in red and the lowest values in blue. Superimposition of individual structures of the assemblies revealed high flexibility of the portal region in the apo protein, specifically α-helix II and the loop between β-strands 5 and 6. (B) Quantification of differences in the positions of individual CRBP1 structures resulting from the crystallographic ensemble refinement. RMSD differences were calculated for the main chain of each residue using Chimera software version 1.16. (C) Comparison of the differences in normalized equivalent B-factors for apo and ligand-bound CRBP1 structures. The Beq values for the main chain of each residue in the holo structures were subtracted from the corresponding Beq values of the apo protein. The graph shows the cumulative differences and the contribution of individual structures of CRBP1 bound to inhibitors 1–6 and abn-CBD. The protein regions with increased conformational dynamics are labeled. The color scheme corresponds to panel (B). For comparison, the differences in the Beq values for the protein structures in complex with atROL and abn-CBD are shown at the bottom of the panel.

