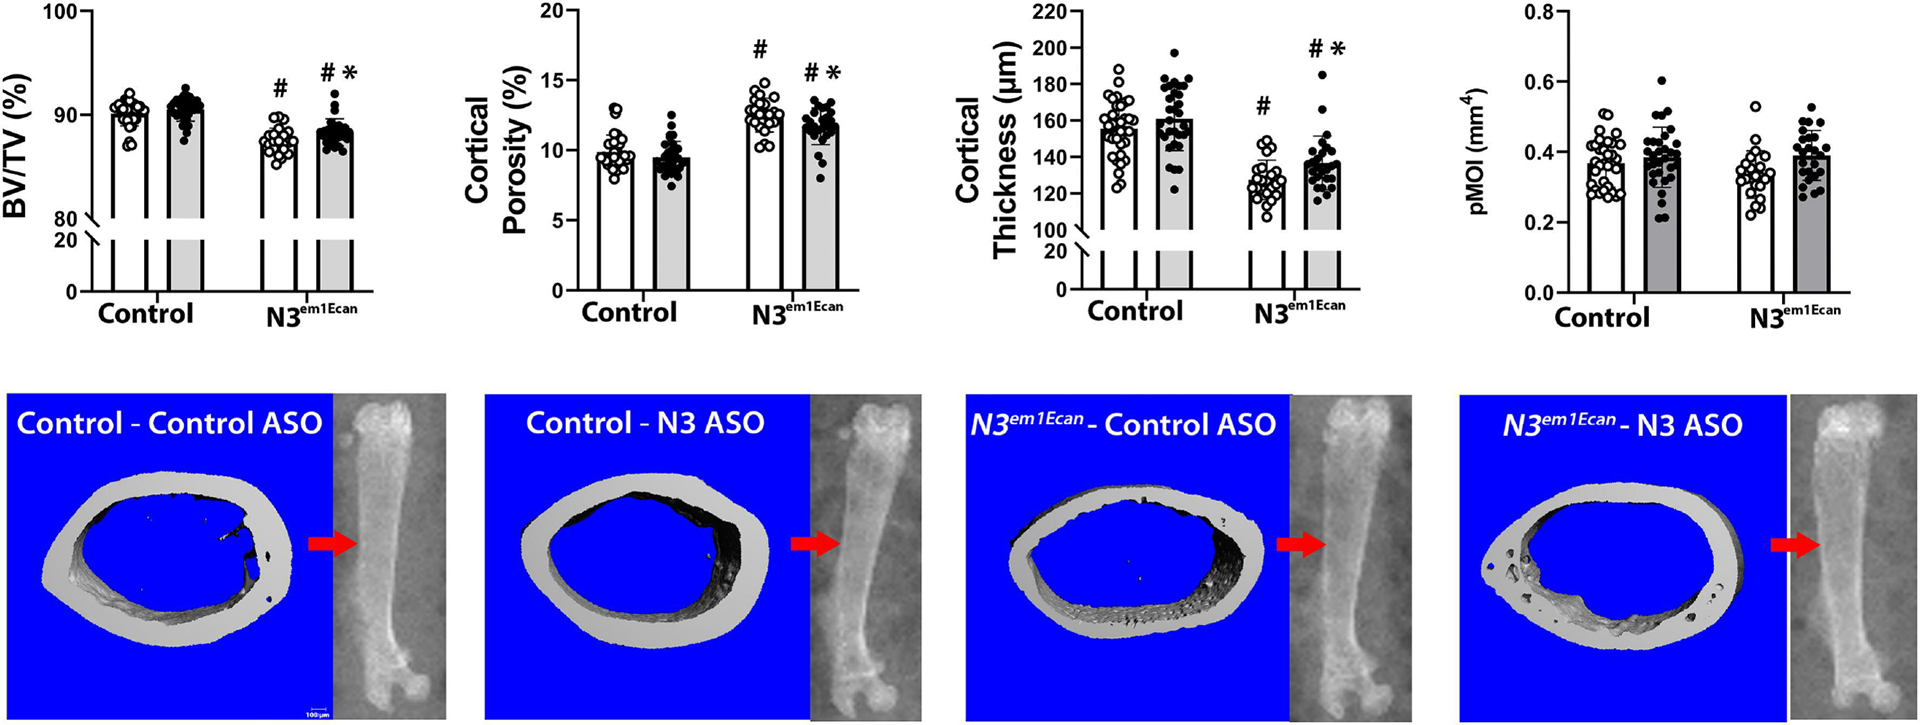
Figure 6.

Cortical bone microarchitecture assessed by μCT of the mid-diaphyseal femur from 2 month old Notch3em1Ecan mutant male mice and sex-matched littermate controls treated with Notch3 mutant ASO 18 (closed circles, grey bars; n = 32 for wild type mice, n = 26 for Notch3em1Ecan) or control ASO (open circles, white bars; n = 34 for wild type mice, n = 23 for Notch3em1Ecan) both at 50 mg/Kg subcutaneously, once a week for 4 weeks prior to sacrifice. Parameters shown are cortical bone volume/total volume (BV/TV, %), cortical porosity (%), cortical thickness (mm) and polar moment of inertia (pMOI). Individual values are shown, and bars and ranges represent means ± SD of biological replicates. *Significantly different between Notch3 mutant and control ASO, p < 0.05. #Significantly different between Notch3em1Ecan and control, p < 0.05, by ANOVA with post-hoc analysis by Holm Šidák. Representative images show cortical bone osteopenia in Notch3em1Ecan mutant mice and its amelioration by Notch3 mutant ASOs. Scale bars in the right corner represent 100 μm. Arrow on scout μCT images point to the area analyzed.
