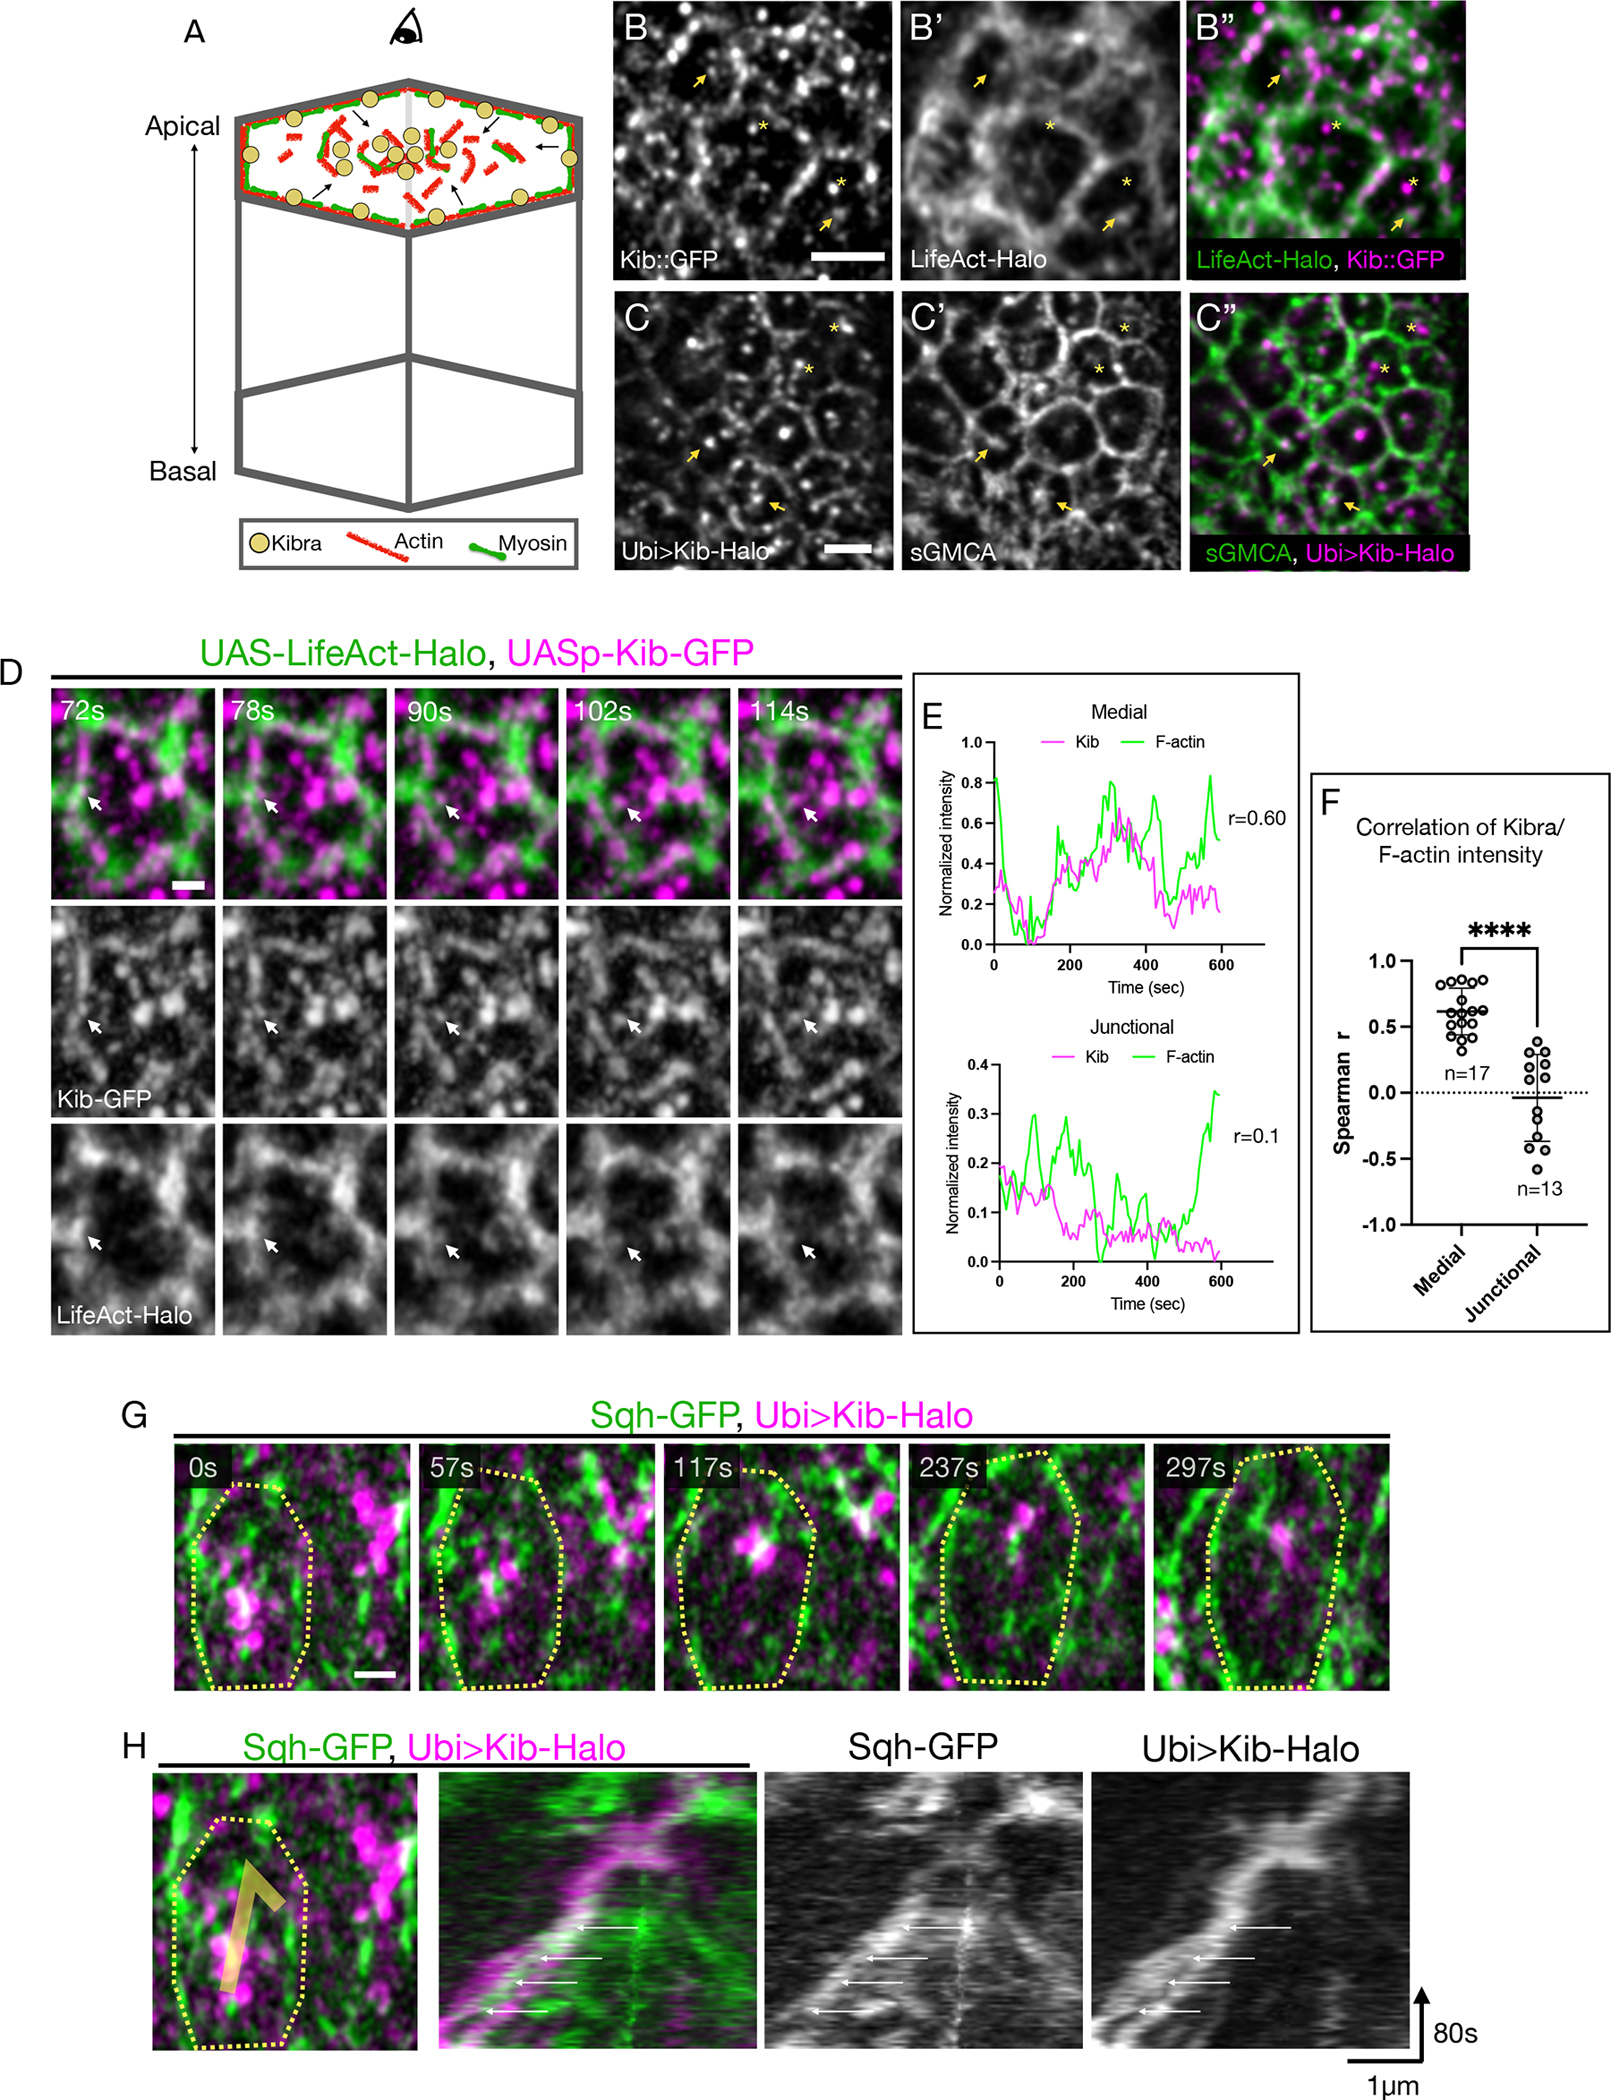
Figure 1. Medial Kib is associated with the actomyosin network.

(A) A cartoon of an epithelial cell polarized along the apical-basal axis. The actomyosin network and Kib are similarly partitioned at the apical cortex into junctional and medial pools. The arrows indicate flows of actomyosin components from the junctional to the medial region. Throughout the paper, images display tissue apical projections as viewed from the top.
(B-C”) Apical projections of wing imaginal tissues expressing either endogenous Kib::GFP and LifeAct-Halo (B-B”) or Ubi>Kib-Halo and sGMCA (C-C”). Arrowheads point to medial Kib punctae that appear to decorate apical F-actin structures. Asterisks indicate medial Kib punctae that do not appear to be associated with F-actin. Scale bars = 2μm.
(D) Single frames from Video S1 of a single cell showing co-migration of a Kib cluster (magenta) with F-actin (green) from the junctional to the medial region (white arrow). Scale bar = 1μm.
(E) Representative plots of medial or junctional Kib and F-actin intensities over time and their corresponding Spearman r correlation coefficient values measured from a single cell.
(F) A plot of Spearman r coefficients from multiple cells comparing correlation of medial vs. junctional Kib and F-actin intensity over time. Statistical significance was calculated using the Mann-Whitney test; n = number of cells. Throughout the paper, unless otherwise noted data are shown as the mean ± SD and significance values are represented as follows: ****p ≤ 0.0001, ***p ≤ 0.001, **p ≤ 0.01, *p ≤ 0.05, ns = not significant.
(G) Single frames from Video S2 of a single cell showing co-migration of medial Kib (magenta) with Sqh (green). The contour line roughly outlines the cell. Scale bar = 1μm.
(H) A kymograph tracking co-migration of medial Kib and Sqh shown in E. The white arrows point to a myosin pulse increasing in intensity over time that is associated with the merger of two initially separate Kib punctae. See also Video S2.
