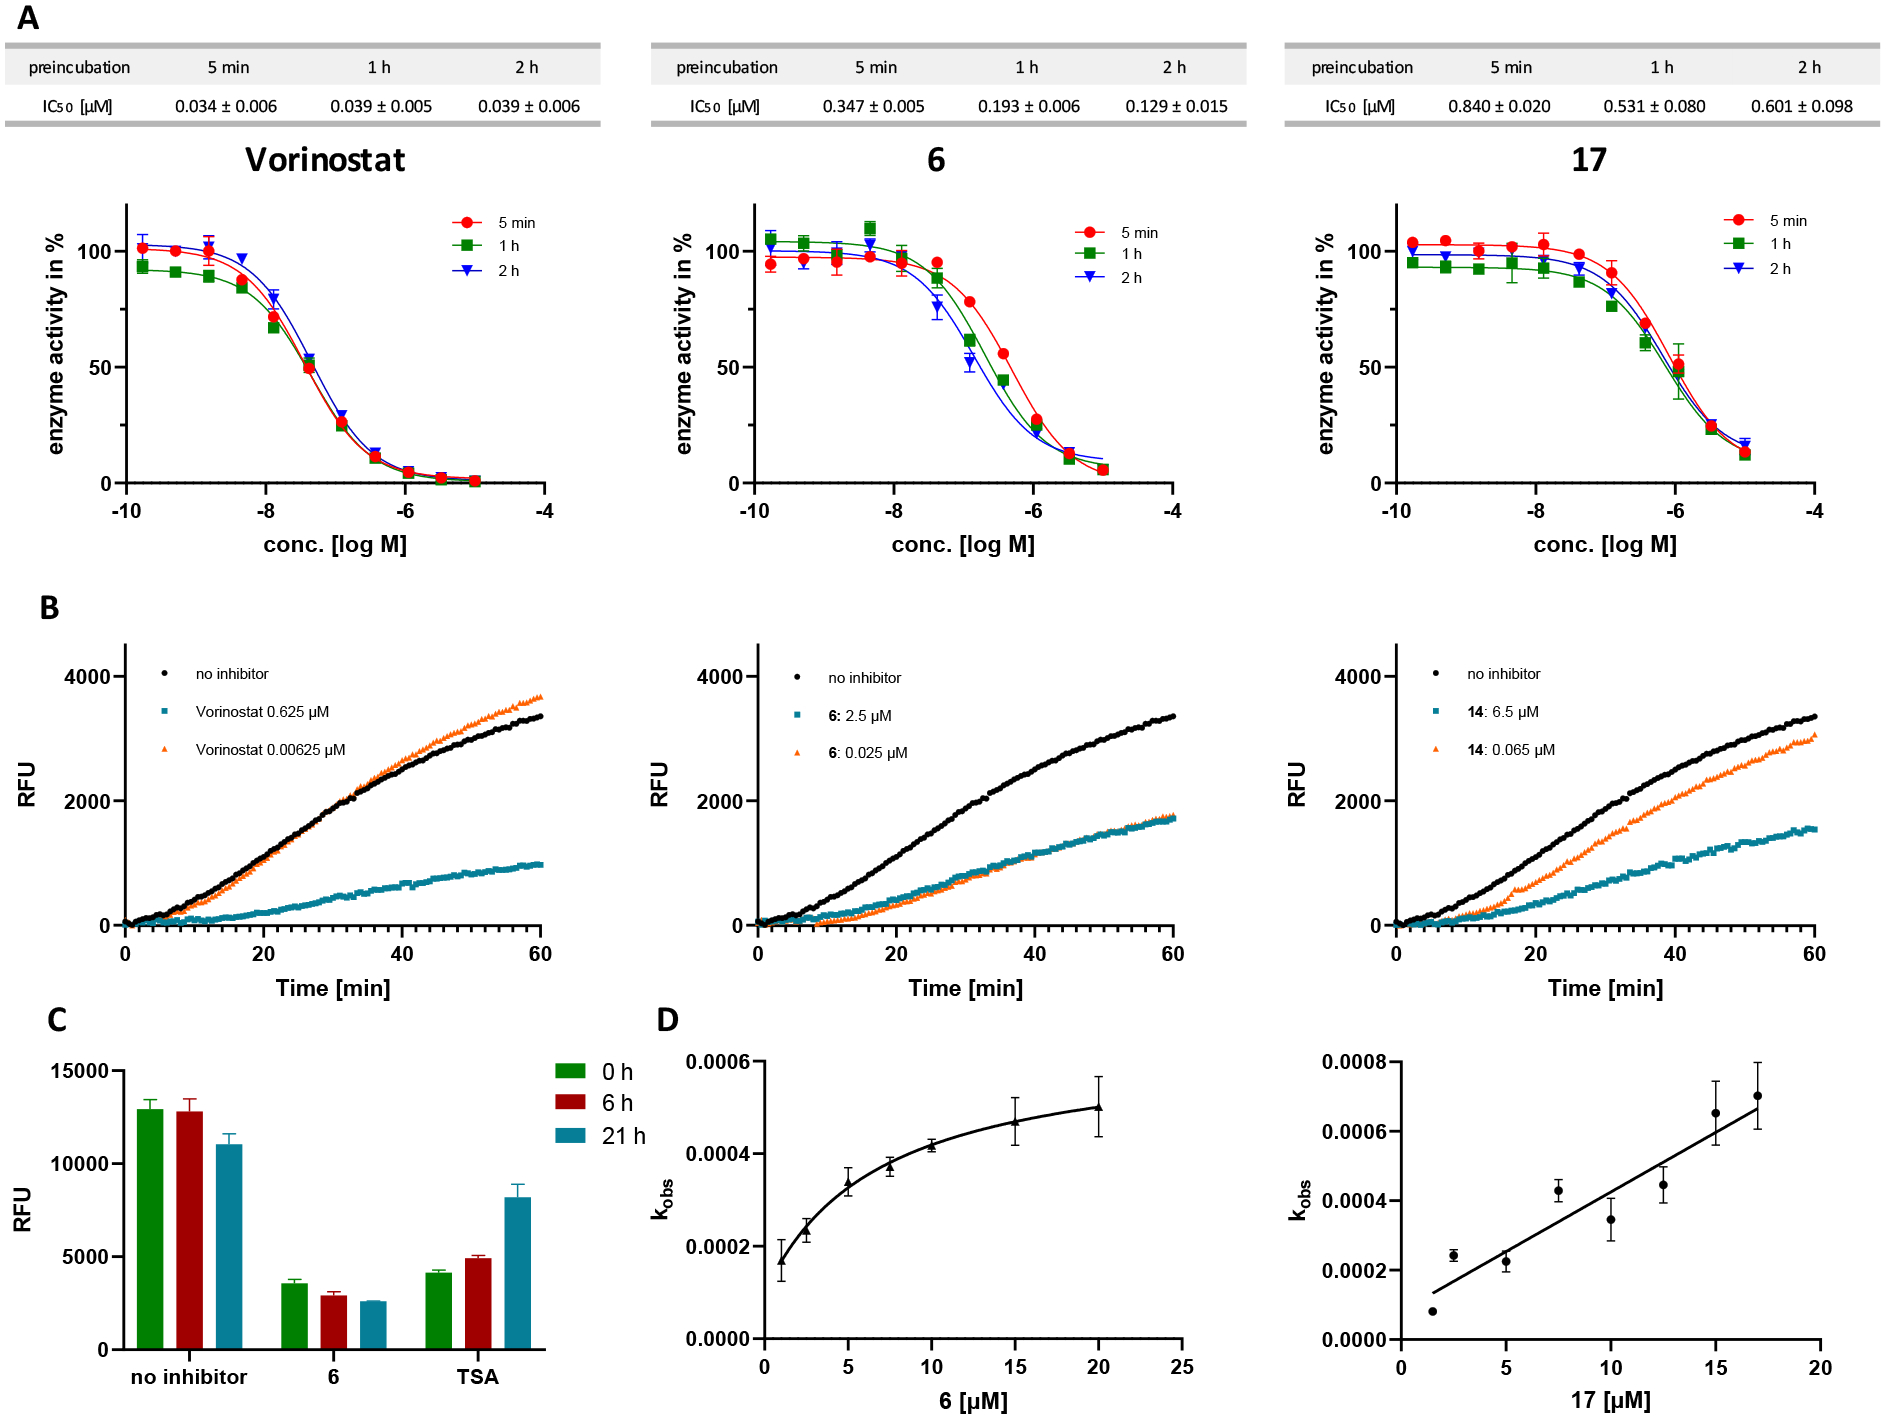
Figure 5.

Analysis of the association and dissociation behavior of 6 and 17 at HDAC6. A: Representative dose-response curves and IC50 values of vorinostat (left, control), 6 (middle), and 17 (right) after preincubation with HDAC6 for 5, 60, and 120 min. B: Progression curves of 100-fold jump dilution experiments with vorinostat (left, control), 6 (middle), and 17 (right) at HDAC6. Inhibitor concentrations are indicated on the left. Fluorescence of cleaved AMC is measured in relative fluorescence units (RFU). C: Recovered HDAC6 activity from samples incubated with DMSO, 6, and trichostatin A (TSA, control) after dialysis against 10.000-fold excess fresh buffer. D: The apparent first-order rate constant kobs (mean ± SD) was plotted against the corresponding inhibitor concentrations [I]. The resulting curves were fitted into Equation 2 or 3 (see Supporting Information). (left) 6: the hyperbolic relationship between kobs and [I] indicates slow-binding, “induced-fit” mechanism II; (right) 17: the linear relationship between kobs and [I] indicates slow-binding mechanism I.63
