
Figure 8.
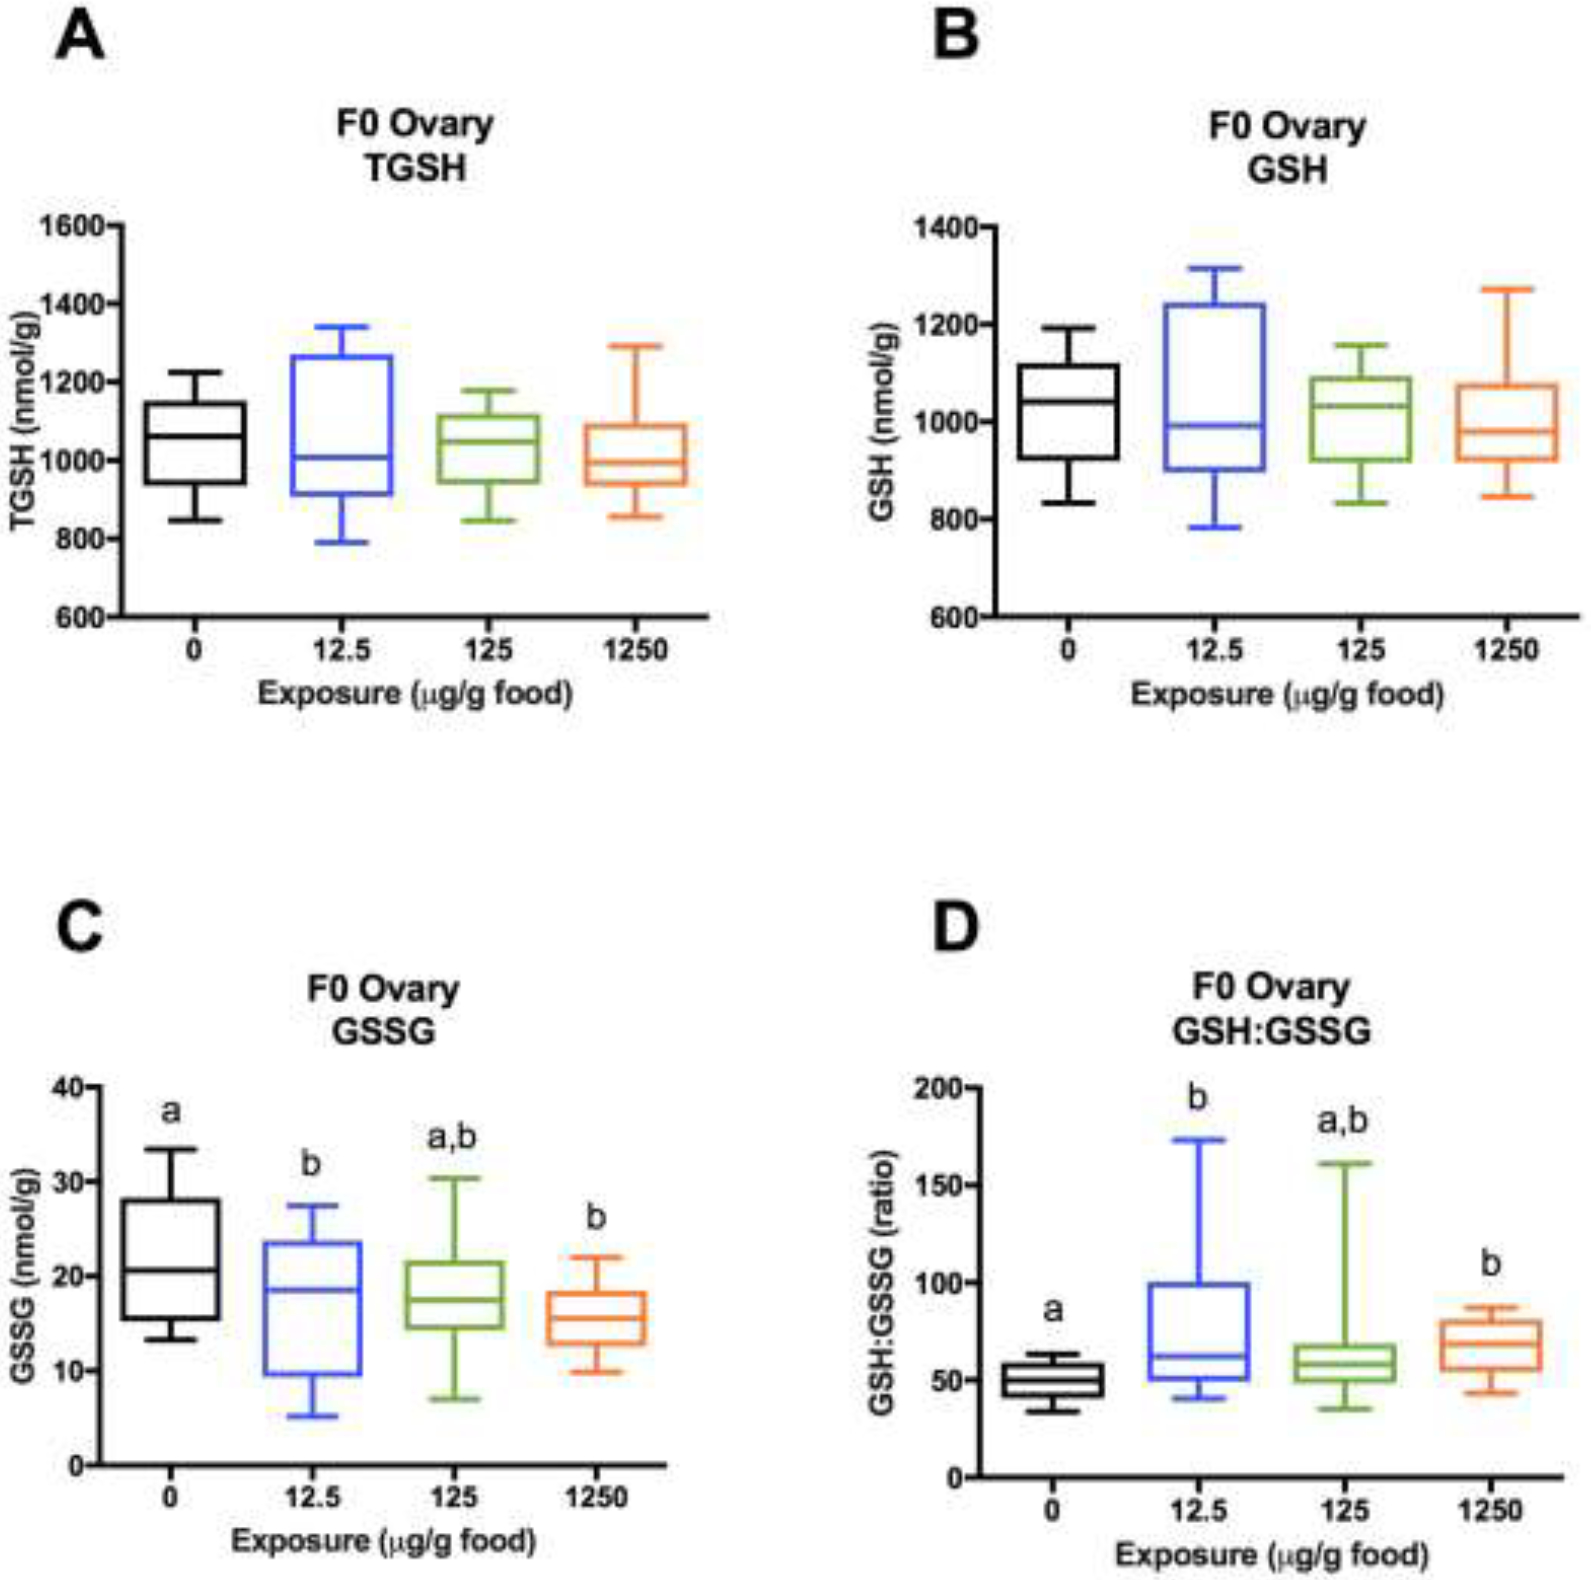
Glutathione concentrations in F0 ovaries (1 ovary/female, 2–5 females/tank, 3 tanks/treatment). (A) TGSH. (B) GSH = TGSH - 2GSSG. (C) GSSG. (D) GSH:GSSG. Data are presented as a boxplot (25%–75%) with whiskers from minimum to maximum. Different letters denote statistical differences across treatments. (Two-way ANOVA with treatment and tank factors; Fisher’s LSD for treatment effects; P<0.05). Statisticss were conducted on log transformed values for GSH:GSSG because standard deviations were significantly different across treatments(Bartlett’s Test; P<0.05), but untransformed values are plotted to showcase unequal variances.